
Sometimes a product flies off the shelf. Other times, you can’t discount deeply enough. Generally, however, items drift along somewhere in the middle, meaning all companies need a handle on what’s moving and how quickly. That inventory turnover calculation informs pricing strategy, supplier relationships, promotions, and the product lifecycle.
Turnover ratio also reveals a lot about a company’s forecasting and inventory management, as well as its sales and marketing expertise. A high ratio implies strong sales or insufficient inventory to support sales at that rate. Conversely, a low ratio indicates weak sales, lackluster market demand, or an inventory glut. Either way, knowing where the sales winds blow will inform how to set your company’s sails.
What Is Inventory Turnover?
Inventory turnover refers to the amount of time that passes from the day an item is purchased by a company until it is sold. One complete turnover of inventory means the company sold the stock that it purchased, less any items lost to damage or shrinkage.
Successful companies usually have several inventory turnovers per year, but it varies by industry and product category. For example, consumer packaged goods usually have high turnover, while high-end luxury goods, such as designer handbags, typically see few units sold per year and long production times. A number of inventory management challenges can affect turnover, including changing customer demand, poor supply chain planning, and overstocking.
What Is Inventory Turnover Ratio?
The inventory turnover ratio is the measure of how many times a company has sold and replenished its inventory over a specific amount of time. The formula can also be used to calculate the number of days it will take to sell the inventory on hand. The turnover ratio is derived from a mathematical calculation, where the cost of goods sold (COGS) is divided by the average inventory for the same period. A higher ratio is more desirable than a low one as a high ratio tends to point to strong sales. Knowing your turnover ratio depends on effective inventory control, also known as stock control, where the company has good insight into what it has on hand.
Key Takeaways
- Inventory includes all goods, raw or finished, that a company has in stock with the intent to sell.
- Inventory turnover is the rate that inventory stock is sold, or used, and replaced.
- The inventory turnover ratio is calculated by dividing the COGS by the average inventory for the same period.
- A higher ratio tends to point to strong sales and a lower one to weak sales. Conversely, a higher ratio can indicate insufficient inventory on hand, and a lower one can indicate too much inventory in stock.
Inventory Turnover Ratio Explained
Ultimately, the inventory turnover ratio measures how well the company generates sales from its stock. Going deeper by calculating and tracking inventory turnover at different levels over time helps businesses make smarter decisions in a variety of areas, including pricing, manufacturing, marketing, purchasing, and warehouse management. In practice, a low ratio on specific stock-keeping units (SKUs), for example, can prompt a retailer to bundle slow-moving or dead stock with popular items that are more likely to move. And if SKUs continue to drag over time, analysts can run further reviews to decide whether these goods are worth carrying at all. A number of key performance indicators can also provide insights into how to increase sales or improve the marketability of certain stock or the overall inventory mix, such as basket size or repeat order rates. AI inventory tools can help inventory teams compare forecasted demand shifts with SKU patterns and suggest adjustments before the stock ties up more cash that may not be recouped if sales drop.
VIDEO: What Is the Inventory Turnover Ratio?
Why Do Inventory Turns Matter?
Inventory turns matter for several reasons. A slow turn can indicate decreased market demand for certain items, which can help a company decide to change pricing, offer incentives to deplete inventory faster, or change the mix of goods offered for sale in the future. These are all important decisions—for a company to remain financially healthy and competitive, it needs to keep its product mix aligned with customer demand.
A fast turn may indicate that a company’s purchasing strategy isn’t keeping pace with market demand, that it’s experiencing delays somewhere in the supply chain, or that a particular item is seeing a surge in demand. This information can help a company decide whether to raise prices, increase its orders, diversify suppliers, feature a product prominently in its marketing, or buy additional related inventory. Material requirements planning is a related process to understand inventory requirements while balancing supply and demand.
Inventory Turnover Ratio Formula
To determine inventory turnover ratio, start by calculating the average inventory in a period by dividing the sum of the beginning and ending inventory by two:
Average inventory = (Beginning inventory + Ending inventory) / 2
Then apply the formula for inventory turnover ratio:
Inventory turnover ratio = COGS / Average inventory
How Inventory Turnover Ratio Works
As established, the ratio relies on two figures: COGS and inventory over a set period. Because inventory at any single moment can be distorted by a big sale or a supply chain disruption, most companies use average inventory to smooth out these spikes and dips and get a more reliable measure of what they had on hand. Seasonal products show why this matters. Stock of items like patio furniture or artificial trees is pushed abnormally high just before the season and runs down sharply by the end. So a count taken at a single point could skew the turnover ratio in either direction. Averaging inventory across the period corrects for that. Businesses without much seasonal swing have a choice—they can simplify the calculation by using ending inventory, or they can average inventory across the period the way seasonal businesses do.
That same data can also tell a business how many days of stock it’s currently sitting on. Days sales of inventory (DSI) reframes the turnover ratio in terms of time instead of frequency. Because DSI is just the turnover ratio expressed as days, you can calculate it two equivalent ways:
Days sales of inventory = 365 / inventory turnover ratio
OR
DSI = (Average inventory / COGS) x 365
Let’s consider the example of a business with COGS of $90,000 and average inventory of $15,000:
Inventory turnover ratio = $90,000 / $15,000 = 6
DSI = 365 / 6 = 60.8
OR
DSI = ($15,000 / $90,000) x 365 = 60.8
How to Calculate Inventory Turnover Ratio
Whatever inventory turnover formula works best for your company, you will need to draw data from the balance sheet, so it’s important to understand what these terms and numbers represent.
-
Identify Cost of Goods Sold
COGS is the direct costs of producing goods (including raw materials) to be sold by the company.
-
Find the Average Inventory
Average inventory smooths out the amount of inventory on hand over two or more specified time periods.
Average inventory = Beginning inventory + Ending inventory / Number of months in the accounting period
-
Calculate Inventory Turnover Ratio
The inventory turnover ratio is a measure of how many times the inventory is sold and replaced over a given period.
Inventory turnover ratio = COGS / Average inventory
-
Interpret and Benchmark Inventory Turnover Ratio
A single inventory turnover number means little in isolation and could have countless explanations—maybe a viral trend temporarily spiked demand, or a new tariff changed a global supply chain route. Compare any unexpected results against the company’s own historical turnover, as well as any external turnover data for similar products or wider industry benchmarks to see whether the number is worth further examination or it’s just statistical noise. Generative AI tools can offer teams plain-language explainers for incoming data without spending hours combing through raw data to answer simple questions.
Inventory Turnover Ratio Calculation Examples
Cherry Woods Furniture is a supplier of high-end, handmade dining sets made from specialty wood. Over Q3, its busiest period, the retailer posted $47,000 in COGS and $16,000 in average inventory. To find the inventory turnover ratio, we divide $47,000 by $16,000:
Inventory turnover ratio = $47,000 / $16,000 = 2.94
If Cherry Woods wants to go further, it can compute the average inventory period to find how long it will take to sell the inventory currently on hand. At the current rate, the DSI is:
Days sales of inventory = 365 / 2.94 = 124.15 days
This means that with a turnover ratio of approximately 3, Cherry Woods Furniture sells and restocks its dining sets roughly every four months.
What Is the Ideal Inventory Turnover Ratio?
In general, the higher the ratio, the better, as it most often indicates strong sales. A lower ratio can point to weak sales and/or decreasing market demand for the goods. For most industries, the ideal inventory turnover ratio will be between 5 and 10, meaning the company will sell and restock inventory roughly every one to two months. For industries with perishable goods, such as florists and grocers, the ideal ratio will be higher to prevent inventory losses to spoilage.
However, there are exceptions to this rule. For example, high-end goods tend to have low inventory turnovers. A farmer doesn’t need to purchase a new tractor annually, and most people aren’t scooping up designer jewelry on a whim. And a ratio that’s too high is self-defeating. It may mean your company isn’t purchasing enough inventory to support the rate of sales. Or, you may not be realizing as much profit as you could—see if inching up pricing stabilizes the ratio while also improving your unit margins.
Differences in Inventory Turnover by Industry
High-volume, low-margin industries tend to have high inventory turnovers. Conversely, low-volume, high-margin industries tend to have much lower inventory turnover ratios. For example, Super Coffee sells more caffeinated beverages at lower prices and lower margins than a specialty supplier like Kali Audio, which sells professional-style loudspeakers and monitors for recording studios at higher margins in the same accounting period.
Retail inventory management is part art, part science and demands an understanding of sales patterns, profit margin, seasonality, and other factors. In many cases, retailers use a vertical-specific inventory method, known as cost-to-retail, that estimates the ending inventory value by using the ratio of inventory cost to the retail price.
The US Census Bureau tracks a closely related benchmark—the inventory-to-sales ratio—across major industries every month. This ratio measures how many months of inventory a business holds relative to its sales, so a lower ratio points to faster-moving stock and a higher ratio points to slower-moving stock, the opposite direction of the turnover ratio itself. The table below shows the average ratios from January to June 2026 by industry.
Inventory Ratios by Industry
| Industry | Inventory-to-Sales Ratio |
|---|---|
| Food and beverage stores | 0.76 |
| Merchant wholesalers | 1.20 |
| Retail trade (overall) | 1.26 |
| Manufacturing (overall) | 1.50 |
| Furniture, electronics and appliance stores | 1.59 |
| Building materials and garden equipment dealers | 2.11 |
| Clothing and clothing accessory stores | 2.13 |
What Should I Do About a Low Inventory Turnover Ratio?
A low ratio needs some inventory analysis to discover the cause. Are competitors offering a lower price? Then revisit your pricing strategy. Is market demand for these goods fading? Then a new stock mix is probably in order. Is the purchasing strategy no longer working and inventory is piling up? Then consider adapting your purchasing policy and processes accordingly to prevent tying up too much capital in inventory. Are salespeople underperforming? Consider training to address the way purchasing decisions are now made, or stress the need for sales leaders to come to the table with realistic, not overly optimistic, projections.
Why Is a Higher Inventory Turnover Ratio Better?
Generally, a higher ratio is better because it means strong sales are depleting your stock at a rapid pace. That’s good news for your company, right? Maybe. It could also mean a surge in popularity of these goods—increased market demand—so you may want to increase your orders to suppliers before your competitors buy them out. However, it could also mean you’re not buying enough inventory or you lack supply chain visibility, which is limiting the sales you can make. That spells opportunity, if you can increase your stock of popular items.
Can Inventory Turnover Ever Be Too High?
Yes, it can. If the inventory ratio is too high, meaning somewhere in the double digits, then your company is limiting its revenue by curtailing sales to fit a too-small inventory supply. It usually takes time for new stock to arrive and be placed in the sales cycle. That’s lost time and lost opportunity, too. Aim to increase inventory purchase amounts to bring your ratio down to a more moderate, and profitable, range.
5 Inventory Turnover Optimization Techniques
A primary way to apply inventory turnover ratios in a practical manner is to optimize your inventory management. Here are five ways to do that:
- Tighten the supply chain: Suppliers with the lowest prices may or may not be the best choice. If a product is central to your sales or is seeing a surge in market demand, faster or guaranteed delivery times for those items or vital components may be more important. In any case, simplifying the supply chain to eradicate inefficiencies will benefit your sales, profits, and overall margins.
- Adjust your pricing strategy: Adjust pricing to realize larger margins on items in high demand and to free capital by moving out old inventory, also known as dead or obsolete inventory. If items just won’t sell, consider donating that stock to charity and taking a tax deduction or offloading it through a secondary channel.
- Check or change your ranking in your industry: Are your inventory turnovers in line with the rest of your industry? Are there opportunities for you to maneuver a better strategic position on competitive items when you note emerging trends in your inventory ratios? You can grab more market share and increase your ranking within your industry by managing your inventory more strategically.
- Improve forecasting: Sales numbers and inventory reports supply much needed hard data that make inventory forecasting more accurate. This data can also help with future sales planning, such as suggesting ways to change your product mix or bundle items in creative ways to move slower inventory at potentially higher margins.
- Automate purchase orders: Automation adds efficiencies and may cut costs on its own. But when you couple it with an order management system that facilitates reordering of fast-selling inventory so it’s always in stock, you net even more wins. Consider using an inventory system that will automatically generate purchase orders for your buyers to review; the result will be better control and fewer errors.
How Else Can Inventory Turnover Ratio Be Used?
Inventory turnover ratios are used in several ways to improve inventory management, pricing strategies, supply chain execution, and sales and marketing, among other company success factors. Below are three common uses.
Turnover Trends
Inventory turnover ratios are an effective way to spot both emerging trends driven by market demand and obsolete, or slow-moving, inventory. That way you can get an early and important clue on whether to scale up or down on any product line or brand. This gives you much better control over inventory and a better harvest of sales opportunities.
Segments and SKUs
Inventory turnover is typically measured at the SKU level or segment level for tighter controls on specific stock levels. Inventory segmentation refers to segmenting, or classifying, SKUs based on metrics that make sense for your business. As an example, a retailer might group categories to see how products are performing against others in its portfolio. Alternatively, inventory turnover can also be used at an aggregated level, where you bundle disparate items by, for example, geographic location of retail outlets.
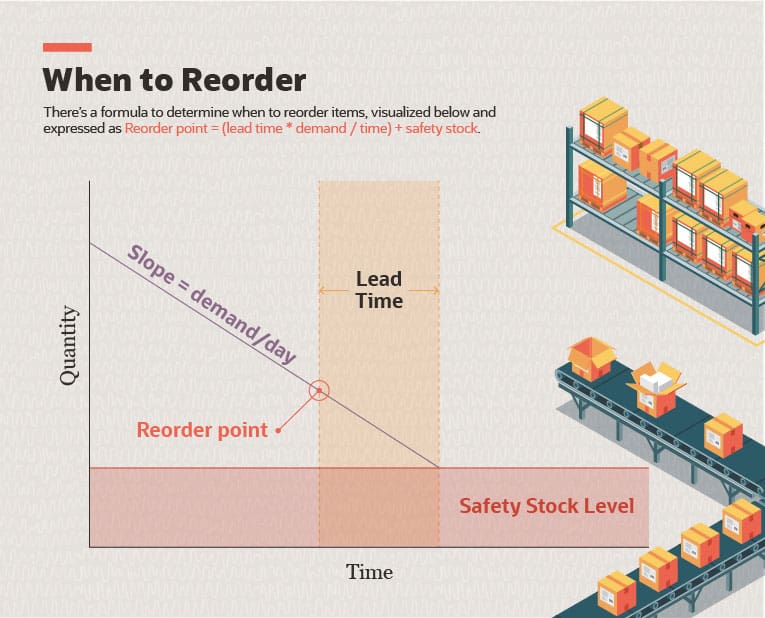
80/20 Rule
The Pareto principle applies to a lot of areas in business and life; when it comes to inventory, it means 80% of your company’s sales revenues are likely generated by 20% of the SKUs you carry. Loss leaders—products deliberately and strategically priced to drive little or no profitability—will always be useful to drive customers into virtual and brick-and-mortar stores, where they might be enticed to buy more, or more profitable products, for example. It’s important to know what that stock segment is so you can keep plenty of inventory on hand.
The Limitations of Inventory Turnover Ratio
Inventory turnover ratio is a useful signal, but it can miss important details if taken out of context. Because the ratio is an average, drops at the SKU- or category-level can be overshadowed by a handful of fast-selling items that lead to a respectable overall ratio. Inventory turnover doesn’t say anything about profitability either—a business can move tons of inventory in a short amount of time, but if those goods come with thin or negative margins, the business may end up in a cash crunch.
The ratio is also backward-looking. Beginning and ending inventory reflect what already happened, so a rising or falling number describes past performance without explanation. The team—or its analytics or AI tools—still needs to dig into demand shifts or supply disruptions to understand why the ratio moved. And because the calculation depends on inventory valuation and count timing, the accounting method (first-in-first-out, last-in-first-out, or another approach) can shift the ratio without any changes in strategy. Comparisons between companies pose the same risk, as two businesses in the same industry can carry different product mixes or seasonal patterns that make direct comparisons less useful than looking at each business’s own historical trends.
Improving Inventory Turnover With Inventory Management Software
Understanding metrics like inventory turnover ratio and DSI is far easier when your stock data lives in one place. NetSuite Inventory Management provides a single, real-time view of inventory across every channel, including warehouses, retail stores, drop shippers, and third-party logistics providers, so businesses can reduce inventory on hand to free up cash while avoiding stockouts. Demand-based replenishment draws on historical sales, seasonality, and lead times to keep the right amount of stock on hand, while AI-powered reporting and narrative insights turn raw inventory data into decisions that lower carrying costs and COGS. By optimizing inventory levels and giving teams companywide visibility, NetSuite helps businesses keep costs low and turnover healthy—all with inventory management capabilities included in the core platform license.
NetSuite’s Inventory Management Dashboard
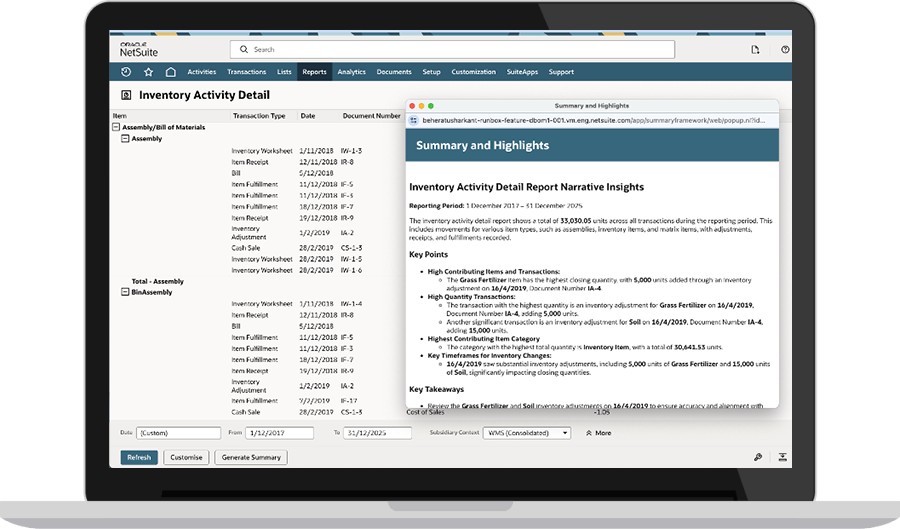
Inventory turnover ratio gives businesses a quick read on stock movements, while ongoing monitoring allows inventory teams to fine-tune purchase orders and clear dead stock before it ties up more cash that could go to restocking items customers actually want. By tracking this metric alongside industry benchmarks, profit margins, cash flow, and SKU-level detail, businesses can get the right mix of safety stock and quick turnover that works for them.
Inventory Turnover Ratio FAQs
What is the inventory turnover ratio?
The inventory turnover ratio measures how often a company sells and replaces its inventory over a given period, usually a year. Businesses can calculate it by dividing the cost of goods sold by average inventory over the same period.
How is the number of days determined for inventory turnover?
Days sales of inventory converts the turnover ratio into a time-based figure by dividing 365 by the turnover ratio. Businesses can also divide their average inventory by COGS and multiply the result by 365 to calculate how many days, on average, it takes to sell through the inventory currently on hand.
What does a high inventory turnover mean?
A high inventory turnover ratio usually means a company is selling products quickly and managing its stock levels well. However, a high ratio can also signal that the company is selling out of goods that are still in demand, which can lead to lost sales.
What does a low inventory turnover mean?
A low inventory turnover ratio often points to weak sales, fading demand, or overstocked inventory. But some high-end or made-to-order businesses may deliberately keep turnover low and carry more stock by design.
How often should inventory turnover be calculated?
Many businesses calculate inventory turnover monthly, quarterly, or annually, but companies that sell fast-moving or seasonal goods may check it more often. Consistent timing is often more important than the exact frequency, since trends can tell more than single data points.
Is inventory turnover a liquidity ratio?
Inventory turnover is generally classified as an efficiency ratio since it measures how well a company manages its assets (stock), not its ability to meet short-term obligations. That said, turnover and liquidity are connected, as a slow turnover ratio can signify that cash is tied up in unsold goods, potentially leading to liquidity issues.
What is a good inventory turnover for my business?
A good inventory turnover ratio depends on the industry, product type, and business model. Perishable goods and high-volume retailers often run higher, while high-end or made-to-order goods typically run lower.