An accurate inventory forecast is invaluable, especially in times when supply chains and consumer demand are changing rapidly. Getting forecasts right requires a mix of data analysis, experience in the industry, and customer insights to metaphorically peer into the crystal ball and predict future demand.
Market forces can change quickly, and something as seemingly insignificant as a product placement by a TikTok influencer could clear out your stock in seconds. Some contributing factors have a significant impact on revenue, while others have only a mild effect. Essential data elements required for accurate inventory forecasting include the following:
- Current inventory levels
- Outstanding purchase orders
- Historical trendlines
- Forecasting period requirements
- Expected demand and seasonality
- Maximum possible stock levels
- Sales trends and velocity
- Customer response to specific products
On a strategic level, forecasters need insights into organizational goals, local and global supply chain challenges, planned marketing pushes and campaigns, potential media influences, and the competitive landscape.
What Is Inventory Forecasting?
Inventory forecasting—also known as demand planning—is the practice of using past data, trends, and known upcoming events to predict needed inventory levels for a future period. Accurate forecasting confirms businesses have enough product to fulfill customer orders while not tying up cash in unnecessary inventory. Forecasting is more than just setting a reorder point—it’s using data analysis to identify patterns and trends to adapt to dynamic conditions and meet customer demand. Reorder points are one important piece, but there is much more to inventory forecasting.
Key Takeaways
- Forecasting demand helps keep enough product on hand while not wasting valuable storage space on unnecessary products.
- Various formulas can help you get started by identifying how long it takes for products or component parts to arrive after you order, at what point you should reorder stock, and how much stock you should have on hand to meet peaks in demand.
- Many factors can affect demand for your product. Some of them are external, such as a storm impacting shipping times, and some are internal, such as a marketing campaign that drives up demand.
- Sophisticated inventory management software can help you automate inventory forecasting, as well as other tasks, such as setting reorder points.
Inventory Forecasting Explained
Inventory forecasting uses data to drive decision-making. It’s the application of information and logic to make sure you have enough product on hand to meet customer demand without overdoing it and ordering too much that you then must pay to warehouse. Forecasters are creating more complex tools like advanced computer-based simulations and futures markets to create demand forecasts.
Inventory forecasting starts with the simple step of looking at how much product your company has sold over time and making sure you have enough to continue meeting customer demand. Next, you start to add complexities, such as seasonality and trend forecasting. Is demand growing? Do you see a spike in demand in a specific season? Other factors are then added, such as planned marketing campaigns and other events that may affect sales. Sophisticated demand forecasting usually occurs with the aid of inventory management software.
Inventory Forecasting vs. Replenishment
With inventory forecasting, you calculate the amount of the different types of inventory necessary for future periods. Factors include replenishment data, such as timing, availability, and delivery speed—also known as lead time. Replenishment is the stock required to meet inventory forecasts based on inventory goals, supply, and demand.
Inventory Forecasting vs. Demand Forecasting
Demand forecasting predicts how much customers will want to buy, based on sales history and market trends. Inventory forecasting turns that prediction into a stock plan. It uses lead times and safety stock to set how much product to have on hand and when to reorder. The two are closely linked but distinct. A demand forecast can be accurate and an inventory plan built on it can still fail, if lead times or safety stock levels are set poorly.
How Does Inventory Forecasting Work?
Inventory forecasting helps companies strike a balance between having too much cash tied up in inventory and having enough stock to meet demand. Three considerations in this calculation are forecast period, base demand, and application of variables and trends.
- For the forecast period, the further out a company goes, the less accurate the forecast becomes. This uncertainty is due to fluctuations in the market, current events, and scientific risk. Standard intervals include 30 days, 90 days, and one year. A one-year forecast interval accounts for seasonal fluctuations.
- Base demand is the known customer need when beginning a forecast. Usually, it uses the prior 30 days of sales and any presales.
- The application of variables and trends is the squishier part of forecasting. Some analysts have a recipe for this; for instance, they may look at global or even local influences and marketing pushes. These include sales velocity, supply chain challenges, and seasonality. Each industry has unique variables that analysts must account for when demand planning.
What Are the 4 Types of Inventory Forecasting Methods?
Even though gut feelings and experience can play a role to some degree, the most efficient forecasting relies on data and formulas. The most common formulaic methods for successful inventory forecasting are trend, graphical, qualitative, and quantitative. Choose the best method based on known stocking issues, personal insights, feedback from sales, customer input, mathematical analysis, and market research.
-
Trend Forecasting
Trends are changes in demand for a product over time. This method projects possible patterns and excludes seasonal effects and irregularities using past sales and growth data. More granular sales data helps this forecasting technique by showing how specific customers, as well as types of customers, will likely purchase in the future. Analysts can find new ways to market and offer sales from this data.
-
Graphical Forecasting
The same data that a forecaster analyzes in trend forecasting can be graphed to show sales peaks and valleys. Some forecasters prefer the graphical method because of its visual nature and the insights available. They can discern patterns from a series of data points and add sloped trend lines to graphs to examine possible directions that might otherwise be missed.
-
Qualitative Forecasting
When they lack historical data, some companies go straight to the source—their customers. Qualitative forecasting often involves complex data collection, such as focus groups and market research. Forecasters then flesh out models from this type of data.
-
Quantitative Forecasting
Considered more accurate than qualitative research alone, quantitative forecasting uses past numerical data. The more data a company has, the more precise the forecast usually is. One example of quantitative forecasting is time-series forecasting, which uses temporal quantitative data to build a model to predict future trends.
How to Choose the Right Forecasting Method
First, consider what data you have available and what you can collect. The process won’t be the same for all organizations. Established companies should start with historical data, perform analysis, and use the quantitative approach. For newer companies, start by collecting qualitative market information. The best forecasting uses a mix of methods and data types. Quantitative data gives modelers a place to start. Adding qualitative data fleshes out the model. Use industry-specific inputs to complete forecasting.
The trick is in making sure the model reflects wild cards—those ever-changing and often unpredictable trends and market upsets that can change demand in an instant. Some of these market upsets are slow to occur, such as changes in styles or fads. When addressing more significant challenges, such as a global pandemic, statisticians should develop multiple models based on historical information and different plausible scenarios, possibly working with scenario planning teams. Forecasters may also incorporate extreme-need scenarios to determine possible demand.
4 Top Benefits of Inventory Forecasting
Inventory forecasting can mean the difference between profitability and piles of unsold goods. When used correctly, inventory forecasting helps companies better plan for potential trends, save money on storage, and keep customers happy. Creating and updating inventory forecasts can be a significant investment of your time and resources, but there are also many rewards to reap when demand forecasting is done well. Here are some of the benefits.
-
Cost Savings
It all comes down to efficiency. By ordering the optimum amount of product, you can take advantage of bulk ordering without tying up money in unnecessary inventory. Those unneeded products or parts also require warehousing space, which adds costs.
-
Customer and Supplier Satisfaction
Having stock on hand helps keep customers happy and improves the likelihood of repeat business. And understanding supplier processes and timelines helps you minimize stock-outs and maintain healthy relationships, with fewer emergency orders and better communication.
-
Back-End Improvements
Inventory and supply chain are intrinsically connected. Improved demand forecasting improves your supply chain management by looking ahead to secure the right amount of stock. Additionally, it can decrease the amount of manual labor that goes into inventory and supply chain management. Reorder points and other steps can be automated. Advanced inventory management software keeps forecasts up to date with new information as it’s fed into your platform.
-
Strategic Insights
Improved communication throughout your enterprise can help you meet company goals—and inventory forecasting can play a key role in driving that communication. For example, by looking at past performance and expected outcomes of a marketing campaign, your inventory managers can make certain there’s enough product on hand to meet customer demand, while also possibly cutting some costs with bulk buying. In this manner, your inventory management team can impact key performance indicators, such as profit margins.
16 Steps to Succeed at Inventory Forecasting
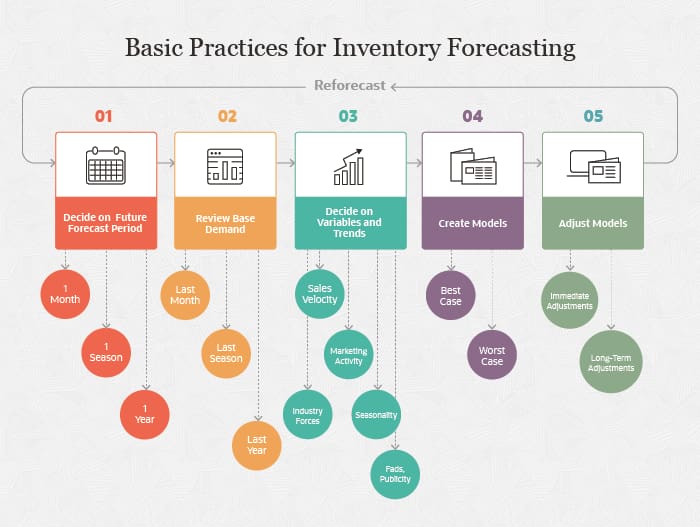
Follow these basic steps to perform an inventory forecast:
- Decide on a future forecast period, such as 30 days, 90 days, or one year.
- Review the base demand for the period. For example, if the company sold 500 units in the last period, the starting data point will be 500 units for the forecasting model.
- Identify trends and variables and their effect on an increase or decrease in sales, such as any promotions or outlying marketing activity that may have affected the baseline demand.
-
Review the sales velocity, which is how fast sales move through the company pipeline. It’s based on the number of leads, average deal value, conversion rate, and the sales cycle length. Calculate sales velocity with this formula:
Sales velocity (SV) = [(# of leads) × (average deal value) × (% conversion rate)] / (sales cycle length)
For example, imagine a scenario where your company has 20 opportunities to sell a product. The percent of these opportunities that usually get turned into a sale is about 50%. The average deal size is $5,000, with a sales cycle length of three months. Sales velocity is [(20 x .50 x $5,000)/90 days] = $555.56. This number means that the product is bringing in about $556 per day in revenue.
- Review upcoming marketing activity.
- Review any pertinent industry forces, such as new competitors in the marketplace, supplier issues, commercial buyer behavior, threats of less expensive product substitutes, and other competitive rivalries.
- Review seasonality as it affects each product. There are many ways to determine seasonality, including calculating a seasonal index for each month, spreading the demand over 12 months, or using more complex statistical methods.
- Consider the possibility of fads or unpaid publicity, including from social media. Because these can happen unexpectedly, many inventory supply experts can’t predict these jumps in sales. Working with marketing staff who may have insight can help you plan for additional stock.
- Create models. Often, this science is more of an art that’s based on all the collected trends and historical knowledge. Use this information to build the models for forecasting. There are many statistical techniques; which ones you choose depends on the stability of the product demand.
- Clean the data by removing unusual or outlier data points and looking for and filling in missing information.
- Identify either a parametric or nonparametric statistical approach. Nonparametric doesn’t necessarily mean there are no parameters to the data, simply that the parameters are flexible. Nonparametric data includes things like histograms and ranked-choice surveys.
- Process the data by loading it or arranging it in a datasheet appropriate for the algorithm.
- Estimate the model parameters: What are the best and worst cases for the data points?
- Validate the model(s). Use different data than what you used to calibrate the model.
- Adjust the model regularly or when events require that you do so. Remember, this is a forecast based on assumptions. Real-life can show it to be off base, so you may need to adjust the parameters.
- Reforecast.
Identifying Inventory Trends and Variables
Some trends and variables are common in forecasting. For example, when a celebrity wears a garment, the fashion industry expects jumps in demand for similar products. This event isn’t an outlier but anticipated, and it often comes with a plan that coincides with product launches and restocking.
Other variables are harder to anticipate. For example, a product that goes viral on social media can sell through a year’s worth of inventory in a matter of days, and because that kind of spike has no precedent in past sales data, no forecasting model trained on history alone will see it coming. Retailers and consumer brands carry the most exposure to this pattern, because social-driven demand plays a larger role in online sales than it did just a few years ago. There are several ways to prepare for these variables, such as investing in faster demand sensing and negotiating surge capacity with suppliers in advance. Both make it easier to react while the spike is still happening. Probabilistic forecasting, which plans for multiple demand outcomes rather than a single number, gives smaller companies a way to hold a deliberate upside scenario for products with breakout potential.
Inventory Forecasting Metrics
Several core metrics tell a company whether its inventory levels are working. Each measures a different piece of the puzzle, from when to reorder to how much cushion to keep on hand.
Reorder Point
The reorder point (ROP) is the stock level that triggers replenishment in an inventory management system. Accountants can manually plan reorder points. Demand planning software is particularly helpful for avoiding stock-outs by ordering the right items at the right time.
Stockouts
Stockouts are when customer demand for a specific product exceeds the inventory a business has on hand. The danger of stockouts is that companies can lose otherwise faithful long-term customers to the competition.
Safety Stock
Safety stock is extra product inventory kept in storage as a buffer against stockouts. Calculate safety stock by subtracting historical data on maximum usage from average daily usage. Some analysts also conservatively include the company’s desired service level.
Lead-Time Demand
Lead-time demand is the time it takes for suppliers and manufacturers to deliver products compared to when they ordered them. Businesses account for the delay from lead time in their reorder point formulas.
Sales Velocity
Sales velocity measures how quickly a product moves off the shelf, usually counted in units sold per day or week. A rising or falling sales velocity is frequently the first signal that a product needs a different reorder pattern.
Inventory Forecasting Formulas
Inventory forecasting formulas help your company have the right amount of stock. Some formulas are less complex than others. For example, understanding inventory turnover helps you see how your company manages its stock. With the right inventory management software, you can also tap into more complex formulas and methods in forecasting, such as regression analyses and multifactorial models.
How Do You Calculate Inventory Forecasting?
Formulas are an important part of forecasting. Examples of formulas include economic order quantity (EOQ), ROP, lead time, average inventory, and safety stock. These are important concepts to understand to build out more complex models for forecasting. Inventory formulas can also help measure the efficiency of operations and help you identify areas for possible improvement. Here are just some inventory management metrics you can track.
Economic Order Quantity
EOQ is the ideal order quantity during regular times. Use this formula to calculate EOQ:
|
EOQ = √2DS/H, where
|
For example, imagine a scenario where a retail store sells 500 sets of gloves every year on average. Gloves are small items, so it only costs the store $1 per year to hold each set of gloves in stock. The fixed cost to order more gloves is $4. EOQ = √[(2 x 500 x $4)/$1] = 63.2. The ideal order size is about 63 sets of gloves.
Reorder Point
Where EOQ is an initial planning formula, ROP accounts for stock replenishment. ROP is the daily usage in units, combined with the days of lead time necessary for replacement, combined with the units of safety stock. ROP validates that your business stays abreast of industry and world events, which can change how and when customers order products. Check and adjust forecasts and ROP at specified intervals. The formula for ROP is:
ROP = (# units used daily × # days lead time) + # units safety stock
For example, imagine a scenario with 100 units sold or used per day, a five-day reorder delivery, and a safety stock level of 75 units. ROP = (100 x 5) + 75 = 575. When inventory falls below 575 units, the company reaches the reorder point and must order more stock. For a more conservative estimate, ignore the safety stock in the calculation.
Average Inventory
This is a measure of how much inventory you have on-hand during a given period. Keeping this consistent over time can help you avoid stockouts while maintaining enough product to fill customer demand. Use this formula to determine average inventory:
Average inventory = (Beginning inventory + ending inventory) / 2
Inventory Turnover
How many times has your company sold and replenished its inventory over the last year? The inventory turnover ratio helps you see how many days it will take to sell the inventory you have on hand. A higher ratio points to strong sales. For this formula, you’ll need to determine your cost of goods sold (COGS)—which is the sum of all direct costs of producing goods, including raw materials—as well as your average inventory:
Inventory turnover ratio = COGS / average inventory
Lead Time
How long does it take for a customer to receive an item after an order is placed? This formula measures the efficiency of your business and gives insight into customer experience:
Lead time = Order processing time + production lead time + delivery lead time
Safety Stock
Think of this as your reserve inventory to make sure you have enough product on hand to fill customer orders. Follow this formula to calculate it:
Safety stock = (Maximum number of units sold in a day × maximum lead time for stock replenishment) — (average daily usage × average lead time in days)
Setting Forecasting Boundaries
Consider the example of when the Toyota Prius first became available in Japan. Forecasters for the car manufacturer knew they would see growth in US markets, but by how much? Prognosticators would need to consider many factors, including advertising campaigns, available stock, and the price of gas. But even in uncertain times, there would be logical boundaries that could be set. For example, it’s highly unlikely that the Prius would push out all the competition and sell more cars than are sold on average in the United States. As you start to consider factors such as market forces, you can begin to set boundaries. The US trade policy shifts that began in 2025 are a good example. When tariff rates shifted sharply within months, the reasonable range for cost and demand assumptions had to shift with it.
Forecasting boundaries help analysts use reasonable and probable logic. They help account for outliers but minimize those with a low probability of happening in your forecasting formulas. Seasonal trends can be some of the trickiest to account for. New products and replenishments are also challenging.
Forecasting for Seasonal Products
Historic demand data and sales figures help account for seasonality. Consider other factors, such as unexpected weather and marketplace trends. One way to account for seasonality is to use the seasonal index formula, which is a measure of the seasonal variation as compared with that season on average. The seasonal index takes away seasonality and smooths out the data. There are multiple methods to calculate the seasonal index, including the simple averages method. The steps are as follows:
- Arrange the data in seasons—most often done in three-month quarters.
- Calculate the season totals and the season averages. In the example below, the season total for Q1 is the sum of all Q1s for the years 2015-2018 divided by four.
- Calculate the grand average. In the example below, the grand average is the sum of Q1 through Q4 season averages.
-
Calculate the seasonal index. In the example below, calculate the seasonal index for each season by:
Seasonal index (%) = (seasonal average/grand average) × 100
Use the seasonal indices in a graph or time-series analysis to project a trend line for forecasting.
Year Sales Organized by Season for Seasonal Indices Analysis
| Year / Measure |
Q1 |
Q2 |
Q3 |
Q4 |
|---|---|---|---|---|
|
2015 |
$4,520 |
$2,300 |
$2,270 |
$3,400 |
|
2016 |
$5,230 |
$2,100 |
$2,900 |
$3,700 |
|
2017 |
$5,340 |
$2,700 |
$2,500 |
$4,010 |
|
2018 |
$5,020 |
$3,000 |
$2,600 |
$4,600 |
|
Season Totals |
$20,110 |
$10,100 |
$10,270 |
$15,710 |
|
Season Average |
$5,028 |
$2,525 |
$2,568 |
$3,928 |
|
Season Index |
143% |
72% |
73% |
112% |
Grand Average: $3,512
Forecasting for New Products
Demand for new products can also be challenging to forecast. Analysts include data on similar existing products as well as qualitative data and tailor models to reflect clusters of products with similar lifecycle curves from which to draw assumptions. Inventory forecasting models should also account for promotional events. Some software systems build promotions, like tax season or back to school, into their forecasting. They may also use past sales history, seasonal modeling, and the dates of the promotions.
Inventory Planning and Replenishment
You can reorder or replenish inventory automatically or manually. The above formulas and models can inform the optimal amount of stock to keep on hand, as well as the number of items to order and how often to order them. As discussed, supplier glitches, transportation issues, and seasonal variances may delay replenishments. Decide whether reordering should be manual or automated with an inventory control system that places orders on a predetermined schedule. If it’s a manual process, make clear who will be responsible for placing the order and exactly how that’s done.
Inventory Forecasting Examples
There are several examples of solid inventory forecasting models. The most prominent formulas are EOQ and ROP. Excel also includes a forecast function that calculates the statistical value of a forecast using historical data, trend, and seasonality assumptions.
Dan Sloan, NetSuite technology consulting manager for accounting firm Eide Bailly, describes one example of forecasting he performed for a consumer goods company where he worked. “They were bringing in products for their fourth-quarter peak season sales,” he said. “The CEO and supply chain director were paying close attention to the labor situation on the Long Beach port and realized that a strike was imminent. They accelerated orders to bring in the product earlier. Since we had a sophisticated demand planning engine in place, it was easy to extend the lead times of those shipments and order them in time to beat the anticipated strike.
“These actions led to a huge win, as their competitor’s containers were held up in the port and missed the crucial two weekends before Christmas. Not only did this lead to record sales, but it provided a competitive advantage in terms of market share going into the next year.”
Sloan’s model for this company included qualitative data, so awareness of local news was important. The platform the company used also enabled it to pivot quickly and order additional products.
Another example is of an electronics company that wanted to gain more market share for its mobile device. Before this, the company used only industry sales data from other companies and did little market research to forecast inventory needs. It usually ended up with too little or too much inventory—and not in the right geographical regions. Customers got frustrated when there were stockouts, creating the potential that disgruntled shoppers would decamp to competitors. When the company had too much inventory, it took a financial hit when the product became obsolete.
Better forecasting for this company came in the form of qualitative focus group data and base demand (for this specific company) spread by region. The company improved communication between marketing and other areas of the business.
A convenience store is a smaller-scale example. New owners wanted a better forecast of their products to avoid excessive spoilage. Each product category the convenience store offers has data from past sales—how much sold, when stockouts happened, seasonal sales trends, and national demand. The savvy owners included local factors, such as a parade nearby and anticipated weather trends. They also surveyed their customers to get their product preferences. They used the data to build a forecast that better stocked their shelves.
Best Practices for Inventory Forecasting
Start by gathering as much data about your sales history as possible. Six months is a good starting place, but a year or two of data can give you better insight into monthly demand. And verify that your data is accurate. Here are some other best practices to consider:
- Build a team that collaborates in developing the forecast.
- Use an inventory management program that works well and provides documented processes.
- Keep a close eye on inventory turnover and whether you meet benchmarks.
- Use qualitative information to drive forecasting.
- Use all available historical supply and demand data.
- Calculate all past margins and profits and future goals, such as gross profit margin.
- Use the ROP formula.
- Carefully measure sales trends so you can be as precise and accurate as possible.
- Use lead time to better understand demand.
- Calculate safety stock.
- Use software that supports your forecasting needs.
Another tip from Eide Bailly’s Dan Sloan: “Make sure that your demand planning engine is looking at where you fulfilled inventory from and where you sent it. For example, if you shipped a bulky item from your Los Angeles warehouse to a customer in Florida, you want to make sure you stock that item next time in your North Carolina warehouse.” Learn from past demand, and regularly implement new practices to support these lessons.
Supportive tools for inventory forecasting include basic spreadsheets and inventory management software systems. Basic spreadsheets aren’t dynamic and lack many of the tools that can help you with more accurate forecasting and other functionalities, such as setting automatic reorder points. Here are some tools to calculate demand:
- Spreadsheets: In businesses that have only a few products, basic spreadsheets can work. Use them to load in formulas and assumptions and perform basic calculations.
- Graphs: Simple graphs with time-series data can show future projections in a format that visually oriented people will appreciate.
- 3PLs: Third-party logistics companies, also known as 3PLs, often have statistical modeling experts on staff to meet the needs of growing businesses.
- Models: The point of forecasting is to build a model that’s best for your business. In this way, you can load changes to the data and new scenarios into the model to see how stock quantities should change.
- Inventory management software: When considering which inventory management system is right for your company, look for platforms that offer embedded forecasting tools. The most advanced systems connect with your existing systems, such as ERP, so your inventory is managed from the same digital portal as your supply chain, customer relationship management, accounting, and more.
Automated Inventory Forecasting
Automating the forecasting process cuts down on a lot of the time teams spend updating spreadsheets and recalculating reorder points by hand. Inventory management software can refresh forecasts on a set schedule or continuously as new sales and order data comes in. Automation can also initiate purchase orders once inventory falls below a set point, which closes the lag between spotting a shortfall and acting on it.
AI in Inventory Forecasting: The Next Frontier
AI adoption in supply-chain planning is still mostly in the pilot stage. A McKinsey survey found only 19% of companies were deploying AI tools for supply chain at scale as of December 2025, with about three-quarters still piloting, blueprinting, or planning. But there’s momentum. Separate research from MHI and Deloitte found AI for supply chain in use at 28% of firms as of the end of 2024, with another 54% reporting that they plan to have it in use by 2029. Where it works, machine learning blends real-time signals, such as point-of-sale data and web traffic, into forecasts that update continuously and helps identify the SKUs most likely to need a planner's attention. Accuracy still depends heavily on data quality. Forecasting models, whether statistical or machine-learning-based, perform well when historical data is clean and consistent and struggle when it’s sparse or inconsistent.
Simplify Your Inventory Forecasts With NetSuite
Balancing enough stock with too much stock can decide whether a business turns a profit or ties up cash it needs elsewhere. NetSuite Inventory Management software offers native tools for tracking inventory across locations, setting reorder points, managing safety stock, and running cycle counts. Built-in demand planning features use machine learning to generate forecasts and identify the exceptions that need a planner’s attention. AI-generated commentary explains what’s driving the numbers behind each forecast. NetSuite Inventory Management runs on the same platform as accounting, order management, and fulfillment data, meaning forecasts stay current without manual data transfers among systems.
Nothing is certain in life. But that uncertainty can present an important opportunity for those who are prepared. Forecasters aren’t in the business of certainties. Instead, they look at the undercurrents in the market and society that could lead to a range of possibilities and plan accordingly. Forecasts are based on data and logic, and models created from historic performance and other factors are refined over time and often helped by sophisticated technology. Inventory management software can be a key component to your company’s success by making sure you have the right amount of product to meet customer demand while not unnecessarily tying up funds in unneeded inventory.
Inventory Forecasting FAQs
How is inventory forecasting done?
The basic premise of inventory forecasting is to look at historic demand for your products and forecast the amount you’ll need to meet customer demand. Start by gathering previous sales data—unless it’s a new product, six months is the minimum. Find the average amount you need, look for seasonal trends, and consider other factors that may affect future sales. For example, do you have a marketing campaign rolling out that may increase sales?
What are the four types of forecasting?
The four types of inventory forecasting are trend forecasting, graphical forecasting, qualitative forecasting, and quantitative forecasting.
How do you calculate projected inventory?
Some of the fundamental formulas to consider are safety stock to guarantee you have enough stock on hand to cover needs if you run out and need to order more; reorder point to know at what level of inventory you need to place another order; and lead time so you know how long it takes to receive new products or component parts after an order is placed.
What are the best tools for inventory prediction?
Basic spreadsheets can work for businesses with only a few products, but most companies outgrow them quickly. Dedicated inventory management software with built-in forecasting tools handles more complexity, and platforms that connect directly to a company’s ERP data usually produce more reliable forecasts than standalone tools that need manual data transfers.
How can I improve inventory forecasting accuracy?
Accuracy usually comes down to data quality more than the specific formula or software used. Start by cleaning up historical sales data and matching the forecasting method to each product type. Use simpler statistical methods for stable, high-volume items and more complex models for new or unpredictable ones. Track forecasts against actual results regularly and adjust the model when conditions change.