
In short:
- Firms that were booking a few million in annual revenue may now find themselves scrambling to meet more complex, and more urgent, client needs.
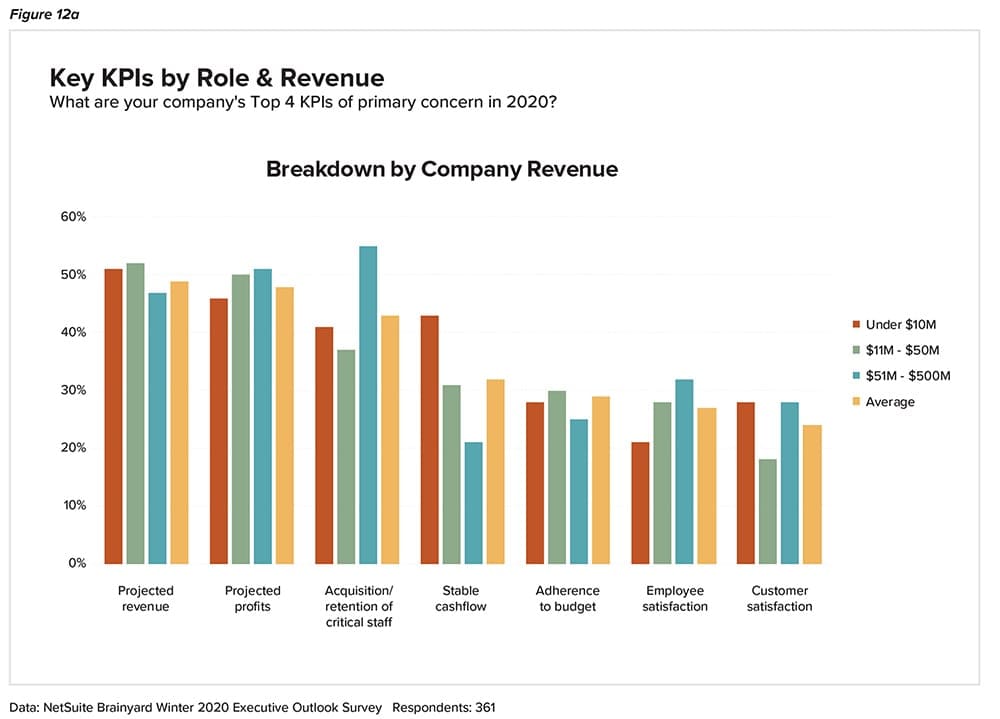
- There’s a core set of KPIs that every consultancy should calculate. They gauge the health of your business overall and will reveal areas to improve.
- Not all customer churn is created equal.
The global professional services market(opens in a new tab), including legal, accounting, engineering, design and other skilled consulting, was worth nearly $5.7 trillion in 2018, having grown at a compound annual growth rate of 7.4% since 2014. Prior to the coronavirus crisis, analysts expected that CAGR to jump to 9.1% and yield a nearly $8.1 trillion valuation by 2022.
Whether we come close to that depends on how 2020 shapes up in terms of a recovery. From our perspective, though, skilled consulting overall should be resilient. That’s because what’s driving client need is the complexity all businesses need to deal with now. Factors including internationalization, tariffs, talent shortages, increases in regulation, new reporting requirements, M&A activity and increased use of digital technology have led to more, longer and deeper engagements for some professional services organizations. Now, the tax and business implications of COVID-19 — and, for some companies, confusion around government loans and grants — are making expert advice even more important.
Analysis from IBISWorld suggests that(opens in a new tab), while U.S. demand will drop for nonessential services, professionals providing accounting, legal and management consulting may see a spike in demand from clients seeking advice on how to protect themselves legally and financially as the pandemic shifts us into a new normal.
Still, like all businesses, consulting firms need to focus on the right stuff as they move from highly entrepreneurial, emerging startups toward sustained, predictable, profitable growth. And because client needs are becoming more diverse, there’s increased pressure to add people with advanced skills and spin up new services.
Growing consultancies may not have needed centralized systems to capture contacts, activity, notes, quotes, estimates, plans and hours spent per customer. But without those capabilities, you have limited ability to spot support issues, forecast sales, execute campaigns, identify cross/upsells, do analysis or create meaningful reports that provide insight into the overall health of the business.
The complexity of managing a $5 million to $10 million consulting firm versus that of a $2 million to $4 million business, especially in times like these, can only be wrangled with better time and project management tools and by getting serious about establishing key performance indicators. Here we’ll discuss eight core KPIs that will help executives understand the health of the business and enable financial teams to identify and manage challenges as they come up.
The Fundamentals
Every business needs to track quarterly and annual revenue and have a fairly exact calculation of monthly income and sales outstanding. In professional services, it’s a good idea to also calculate quarterly and annual gross and net margins, in a consistent way, to provide a top-level picture of company health.
The following eight KPIs for consulting service can help benchmark progress.
1. Billable Utilization Rate
This is expressed as the percentage that resources are billed for in a given time period. Most commonly it is calculated based on a 2,000-hour work year or a 40-hour work week. Here’s an example calculation of billable utilization rate:
Billable Utilization Rate = 100% * Hours Billed / 2000
Overall, your billable team members should spend about four days per week with customers. That number can go up for longer client engagements, or down when your team is learning new skills, processes or tools.
This is a good fundamental measure, but you also need to look at whether resources are being allocated correctly.
2. Revenue Per Billable Resource
Pricing services right for profitability means making sure the right consultants (based on skill sets, experience, certifications) are assigned to activities that maximize billing rates. Senior staff working on simple projects is a waste, while project managers don’t want inexperienced resources attacking problems beyond their skills and potentially putting customer relationships at risk. Revenue per billable resource indicates how much revenue your billable resources generate during a specific time period, as well as the productivity of your consultant team. This number should be higher than the average fully loaded cost of your consultants, meaning your consultants are generating more revenue than it costs to employ them.
Here is the formula to calculate this KPI:
Revenue per Billable Resource = Total Revenue / Billable FTEs
This calculation gives you a way to compare annual and year-over-year progress. If you can, find competitive data that provides another touchpoint for similar businesses in your area. But stay local — national comparisons are less helpful because rates for services vary widely depending on practice focus and the regional cost of labor.
Another way to approach revenue per billable resource is to use it to determine gross margin per billable resource, or in some cases, margin per contracted resource, to see if the cost per resource aligns with your desired gross margin. But ultimately, changes in revenue per billable resource are a good measure of your efficiency and the quality of the engagements you’re taking on. It’s one KPI that can be shared with your sales team to work through the sorts of clients that are a best fit for the resources you have, and conversely, to understand opportunities that don’t fit your current mix. It can also highlight unprofitable customers.
Revenue per billable resource varies widely depending on the type of consultancy and services provided to clients. Architecture, engineering, and legal consulting firms tend to see a higher annual revenue per billable resource. In addition, key to project profitability is making sure all time is accurately captured and billed to prevent, or at least reduce, “revenue leakage.” Managing projects tightly to budget with a clear picture of actual versus planned time billed helps drive profitability.
3. Revenue per Employee
An associated measure that helps determine the efficiency of the organization is monthly or annual revenue per employee, calculated as:
Revenue per Employee = Total Revenue / FTE Headcount
Comparing revenue per employee with revenue per billable resource over time is a way to see whether overhead is growing faster than the overall business.
4. Project Margin
The concept of margin is simple enough:
Project Margin = (Project Revenue - Project Cost) / Project Revenue
But all too often, businesses don’t take the time to figure out the actual cost of projects, much less chart project margin to look for trends in performance. This exercise is worth doing. It will shed a lot of light on which teams perform better, which classes of customers are more profitable and where unexpected costs are putting a dent in margins.
Particularly when sales teams are paid based on revenue rather than earnings, it’s important to watch that discounts for large or repeat customers aren’t pushing margins negative. Big, multifaceted deals with marquee customers are often so attractive that it’s tempting to offer discounts that veer outside the guardrails that finance has set up. Once you do, it’s all but impossible to move those customers back into profitable territory.

Cash Flow is King: 4 Sure-Fire Ways to Get Paid Faster: Here’s how to optimize your billing processes using technology, thoughtful invoice composition, incentives and tactical timing. READ NOW!
5. Project Overrun
One of the finer arts in professional services is project cost estimation. To know whether you’ve perfected the craft, check to see how resources actually used compare with the original bid. A back-of-the-napkin check can be as simple as looking at billable hours expended compared with estimated.
Project Overrun = Estimated Billable Hours – Actual Billable Hours
Even if you charge by the hour, overruns still can have negative effects.
First, you’ve charged the customer more than you quoted. That may create ill will, unless the overrun was due to scope creep and the customer agreed to a bigger bill. Second, your billable resources stayed on a project longer than expected. That can delay other engagements or eat into training time.
Either way, all project overruns need to be tracked and the reasons behind them understood. From time to time, they should be examined holistically to see if your project cost estimation approach needs refinement or if certain teams are commonly exceeding billable estimates.
While time is likely to be the most commonly overused resource, also look at other billables, particularly if you’re using cloud or other services that are purchased on a granular usage basis but included in contracts as single line items.
7 Steps to Recession-Proof Your Business

6. Churn Rate
Keeping and growing existing profitable customers is always less expensive than replacing that business. Churn rate is an indication of customer turnover and is usually calculated monthly, quarterly or yearly. The calculation can be as simple as:
Churn rate = 100% * Customers Lost This Period / Total Customers At The Period Outset
Related, you can simply track the number of customers at any point in time and compare that to what you had last period or last year at the same time to determine if you’re replacing customers faster than you’re losing them.
The problem with both of these calculations is that they value all customers equally. With any service, clients will kick the tires, possibly take a test run and then evaluate whether the offering is right for them. You can’t be all things to all people, so if you lose a few customers in the first 90 days of their subscription, or after the first one or two engagements, it shouldn’t carry the same weight as losing a customer who’s been with your firm for a few years. The subject of how to weight customers in churn rate calculations is the sort of thing that economists talk about at length in their master’s theses, and you can find lots of discussions on methodologies(opens in a new tab) online.
Two elements to consider: Was the customer loss an unforced error, where your team did something wrong, so they went elsewhere, or was it forced, where they went through an acquisition or other event that led them to either choose another service provider or pull back on spending? That could easily be the case if you do a lot of business with, for example, restaurants that had to shut down during the pandemic.
First, as in baseball, unforced errors are a problem. Second, even when a customer left during a trial period, you should still try to find out why they went elsewhere, whether through a survey or a call by the sales manager.
Finally, churn rate is more important for professional services where business is likely to recur. If you’re an accountant or perform information security evaluations, that’s a different sort of gig than an architect or highly specialized law firm, where one-off engagements are common.
7. Days Sales Outstanding
The simple definition of days sales outstanding (DSO) is the average number of days that it takes a company to collect payments due. It’s not uncommon in the services sector to see a DSO greater than 50 days, and there are many factors that could be negatively impacting collection rates.
Here’s the math:
DSO = (Accounts Receivable / Total Revenue) * 365 days per year
In part, DSO is a function of how you write contracts. For long engagements, calculating DSO from the time of sale will clearly demonstrate why partial payments need to occur through the course of the contract term. Cash flow becomes too irregular, and risk of nonpayment can also go up, if settlement is held until the end of the engagement.
Besides careful contract creation, automating billing functions can go a long way toward ensuring that your DSO stays as low as possible. Both can allow for taking on longer, bigger and more complex client engagements while ensuring a steady cash flow.
A monthly — or even more frequent if you work with clients on the edge — check of DSO will help spot cash flow risks if and when they develop.
8. Referenceable Customers
Maintaining positive customer references is critical to success for any consulting service company. Not only will this result in repeat business from satisfied customers, but these customers are also a great tool for prospecting new clients. Sharing genuine customer success stories from customer to customer enables brand building and validates your offering compared to your competitors. The larger your customer reference program — the KPI tracks the number of customers who are willing to share their stories — the easier it is to find relevant success stories to share with your prospect.
Increase Billable Hours and Profitability With NetSuite
Every hour counts when you’re running and growing a consulting firm. The ability to maximize billable hours and profitability lies in the company’s ability to minimize the time spent on time-consuming unbillable administrative tasks. NetSuite helps consulting firms overcome this critical challenge, and others, via SuiteProjects, its cloud-based professional services automation solution. Natively built into the NetSuite Enterprise Resource Planning (ERP) platform, SuiteProjects provides real-time visibility across multiple projects no matter where they are in their life cycles. Key features include project, staff and time/expense management; billing and invoice management; and project accounting and revenue management. Configurable dashboards display key performance indicators, such as project margin and revenue per billable resource, that help keep consulting firms on track to increase their efficiency, deliver projects as quickly as possible, speed the billing process and, last but certainly not least, boost profitability.
Those are our top KPIs that we think every consulting shop should track. In many cases, the concept behind KPIs is straightforward, but calculating the elements that go into the measurement can be tricky.
For instance, in any calculation that involves staff FTE compensation, salary is just part of the picture. The more complete, or fully burdened, number includes salary, benefits, payroll taxes, vacation, 401k and so on. At least once a year, it’s worth determining the fully burdened compensation per staffer and using that number as a multiplier against salary in the above calculations. Your burden for billable employees can be different from, say, part-time staff, but once you have the number, it’s generally usable for a calendar year.
Simplified calculations may be fine to spot trends, but when it comes to calculating margins, details matter. It’s easy to lose some spending that should be attached to projects or products. And that will add up over time.