If you’ve ever built a simple Excel formula to test how changing a variable would affect your revenue, you have already created a simple financial model of sorts. Financial models are essentially complex calculators—typically built in spreadsheets—that provide information about likely outcomes based on assumptions from financial forecasts. Business assessments ranging from valuations to credit risk are based on financial models.
Video: What is Financial Modeling?
What Is Financial Modeling?
Financial modeling is a tool for determining likely financial outcomes based on a company’s historical performance and assumptions about future revenue, expenses and other variables. Financial modeling relies on financial forecasts: It takes a forecast’s assumptions and plays them out using a company’s financial statements to show how those statements may look in the future. Because models are created from financial statements, they most often generate results for a month, quarter or year.
Most financial models are constructed in an Excel spreadsheet and require manual data entry. One of the simplest types, known as the three-statement model, only requires an income statement, balance sheet, cash flow statement and supporting schedules. However, the uses for models vary greatly, so some are much more complex. Businesses routinely customize models for their own purposes.
There is software that allows users to optimize forecasting estimates with a rigorous, pre-built statistical modeling engine. With a few clicks, predictive modeling will collect historical data, match it to industry standard statistical models and generate a dashboard, offering predictions for future financial results and enabling users to apply predicted values directly into their plan or forecast. This software can integrate with spreadsheet tools like Excel so you can slice and dice data yourself. It can also run your historical data through pre-built models on its own, to generate financial predictions without your input.
What Is a Financial Model Used for?
Financial models are useful for many applications. Businesses commonly use them for:
- Valuations and raising capital. If you’re aiming to go public, for example, bankers will run financial models to determine how much the company is worth. You might also need to provide models in order to get venture capital funding, loans or other types of financing.
- Budgeting and forecasting. Budget and forecasting models help finance understand the company’s performance based on input from its various components. As each program, department and business unit creates its own budget, they can then roll them up into a single overall financial model for the entire business to be used to allocate resources and predict financial results for the coming year.
- Measuring possible outcomes of management decisions. You might use a financial model to predict changes in revenue if you were to, say, raise the price of your top-selling product next year.
- Credit analysis. Investors will use financial models to determine the likelihood of your business repaying its debts, if they are to lend you funds.
Why Are Financial Models Important?
Financial models are the simplest way to compute performance and express projected outcomes for your company. Depending on the specific model, they can advise you regarding the grade of risk associated with implementing certain decisions. Financial models can also be used to devise an effective financial statement that reflects the finances and operations of company. This is important for pitching investors, securing loans or calculating insurance needs. The applications are virtually limitless, but the basic idea is that they help you understand where your company stands now, how it has performed historically and what to expect in the future.
Who Uses Financial Models?
Anyone with an interest in the financial performance and outlook of a company could use a financial model, and there are courses for developing the skill. However, professionals in business development, accounting, financial planning and analysis (FP&A), equity research, private equity and investment banking frequently develop models in the course of their usual duties. Each of these analysts use different types of models depending on the focus of their business.
What Are Some Examples of Financial Models?
The forms of financial models vary as widely as their functions. For instance, the three-statement model mentioned earlier is the most basic variation. It simply takes previous financial statements and projects them into the future. It provides a complete overview of the company’s past, present and future and has the added benefit of allowing you to see what would happen if you changed some assumptions. For instance, what would happen if we sold 200 more units? Or, what if we reduced our labor costs by 12%?
Another example of a financial model is the discounted cash flow model. To determine valuation for an entire company or a particular project or investment, many analysts would use this model to provide the current value of the company and predict future performance.
Key Takeaways
- Good financial models are easy to understand and well-suited to their purpose.
- If you have basic accounting skills and a solid understanding of Excel, you can build a basic financial model.
- Financial models vary in structure and purpose, but there are some key industry standards to follow, including those around color coding and formatting.
- A financial model is only as good as the assumptions and formulas it is built from, so check your numbers thoroughly.
- Do not include assumptions in your formula, and do not enter the same date twice within your worksheet. Changing your assumptions should automatically affect outputs throughout the sheet.
Financial Modeling Examples
To get a better picture of a financial model in use, imagine a bakery is acquiring a candy company. The bakery could use a complex financial model for mergers and acquisitions to add the valuation of both companies together and present the new valuation of the combined entity.
When pitching to an investor, your company might prepare models that demonstrate the growth investors could expect to see based on your company’s projected sales or improvements in overhead due to economies of scale.
Or, if your print shop is seeking to build a new store with financing from a loan, the bank will use models to determine your company’s creditworthiness and the likelihood that your new location will be successful.
Financial Modeling Best Practices
Even with all the variety and customization of financial models, there are some general industry expectations, formatting and best practices. The best models are easy to read, accurate, well-matched to the application and flexible enough to fully accommodate the complexity of the task at hand. Here are some best practices:
- Develop an understanding of the problem, the users of the models and the overall goal of the model.
- Unless you absolutely can’t avoid it, construct the entire financial model on one worksheet. This makes the model easier to understand and prevents user errors.
- For increased clarity and flexibility, group your sections. Start with your assumptions, then your balance sheet and income statement. Your sections will vary depending on which financial model you are using, but keep them in logical groups that are easy to differentiate.
- Follow standard protocols for color coding. Use a blue font for hard-coded numbers (assumptions). Formulas should be black. Green is reserved for links to other worksheets, and red indicates links to other files.
- Be consistent with number formats throughout your model. For instance, if you choose to identify negative dollar values with parentheses, you should always use parentheses. In Excel, you can maintain this consistency by right clicking all cells that represent financial values, select “format cells,” choose the number tab and click “accounting.” You could also choose “currency,” but this has more options and therefore more opportunities for accidental inconsistency.
- To avoid errors and preserve the readability of the model, every value should have a cell to itself and only appear once in the sheet. You should never embed an assumption into a formula. If you do, you are likely to forget it’s there when you adjust your model, and this could significantly affect the accuracy of your output later.
- Keep your formulas as simple as possible, and break complex calculations into multiple formulas.
- Check your numbers and your formulas. Your model is only as good as its construction, and your output is only as good as the data you use to generate it.
- Test your model. Try to construct scenarios to make it fail so you can refine it or at least understand its limits.
Plan & Forecast
More Accurately
12 Steps to Building a Financial Model
A basic financial model is relatively easy to build in Excel, and it’s good for practicing the Excel skills, formula logic and conventions you’ll need to construct more complex models later. It also lets you play around with your assumptions to see how they affect the output. Follow these steps to build a basic model:
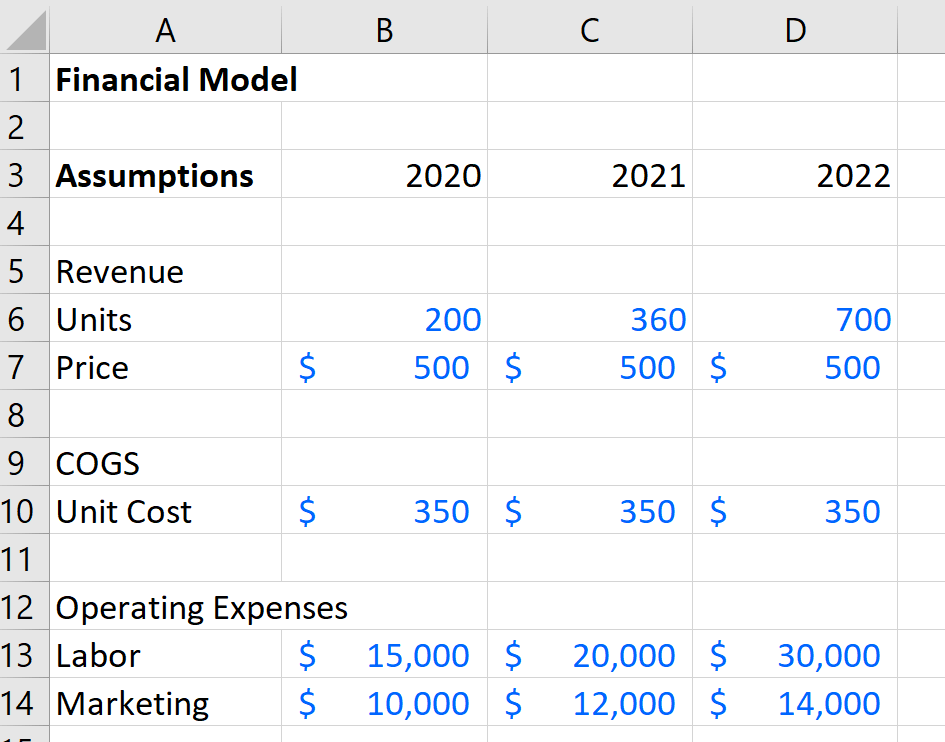
1. Create a new spreadsheet and label the first row “Assumptions.” Label columns B, C, and D with three future fiscal years. In these columns, you’ll make predictions about your performance in each of those years, for a variety of metrics.
2. Label rows with revenue, units, price, cost of goods sold (COGS) and operating expenses like marketing, labor or whichever expense categories are relevant to your business.
3. Fill in the values with your assumptions, based on financial forecasts and your current financial statements. Use a blue font that is easily distinguished from black in the corresponding cells. Remember to format any dollar figures with the accounting number format by right clicking the cells, going to “format cells” and selecting “accounting” in the “numbers” tab.
At this stage, your worksheet should look something like this:
4. This is a good time to freeze panes. To accomplish this, highlight cell B4 or its equivalent in your worksheet, go to “view” in the task bar, and click “freeze panes.” This keeps your labels visible as you toggle around in the sheet. If you pay attention to the row numbers as we move on, you’ll see how this improves readability.
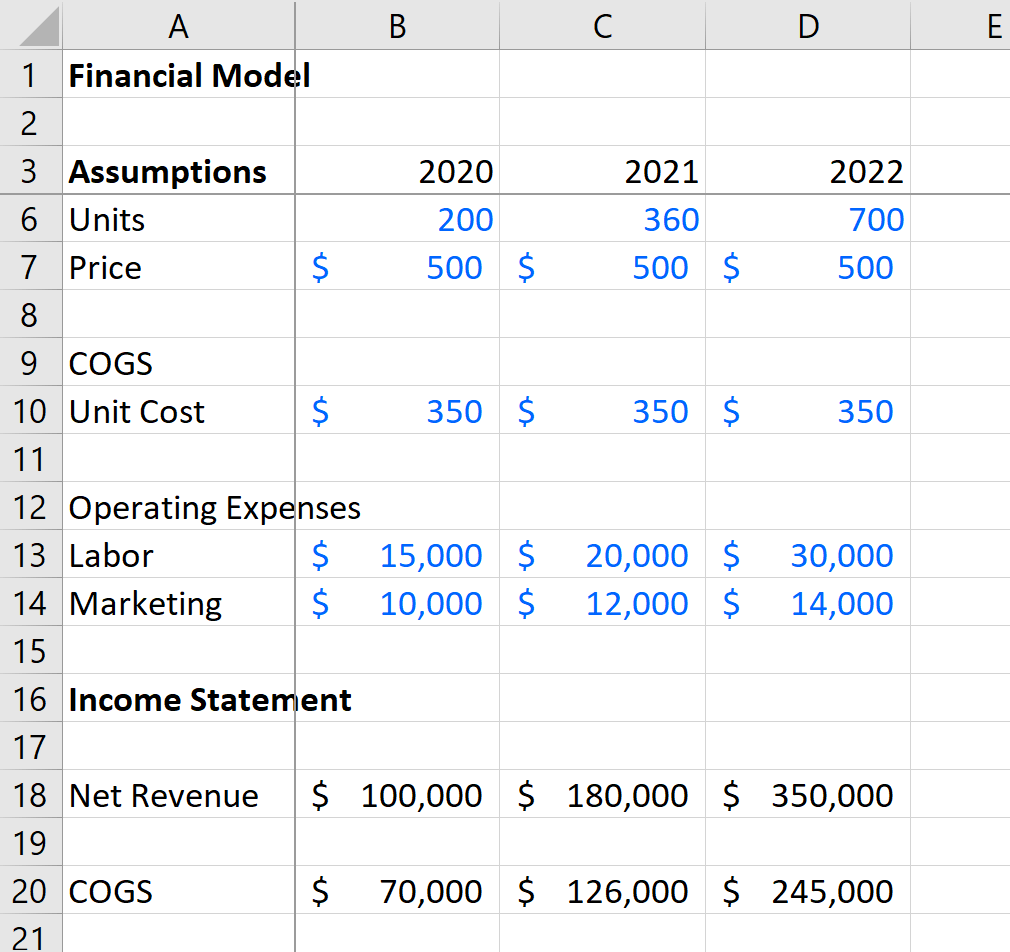
5. Next, move down a couple of rows to start calculating projections for your income statement, beginning with net revenue. The font for these values will be black. You will run the numbers in your assumptions through a formula to calculate net revenues by multiplying units by price (=B6*B7 in the sample above). Copy and paste the formula to the next two cells to the right. Excel should automatically apply the formula appropriately for the year you’re working in, but it’s a good idea to make sure that it did by double clicking the cell to view the formula. Ensure that the letters match the column for that cell. Make sure your number formatting is set to “accounting.”
6. Calculate COGS by multiplying units by unit costs (=B6*B10 in our example). Just as before, copy and paste that formula in the two cells to the right, checking to make sure it was applied appropriately for each column. Check your number formatting to ensure that it’s “accounting.” Now, the format of your worksheet should resemble this:
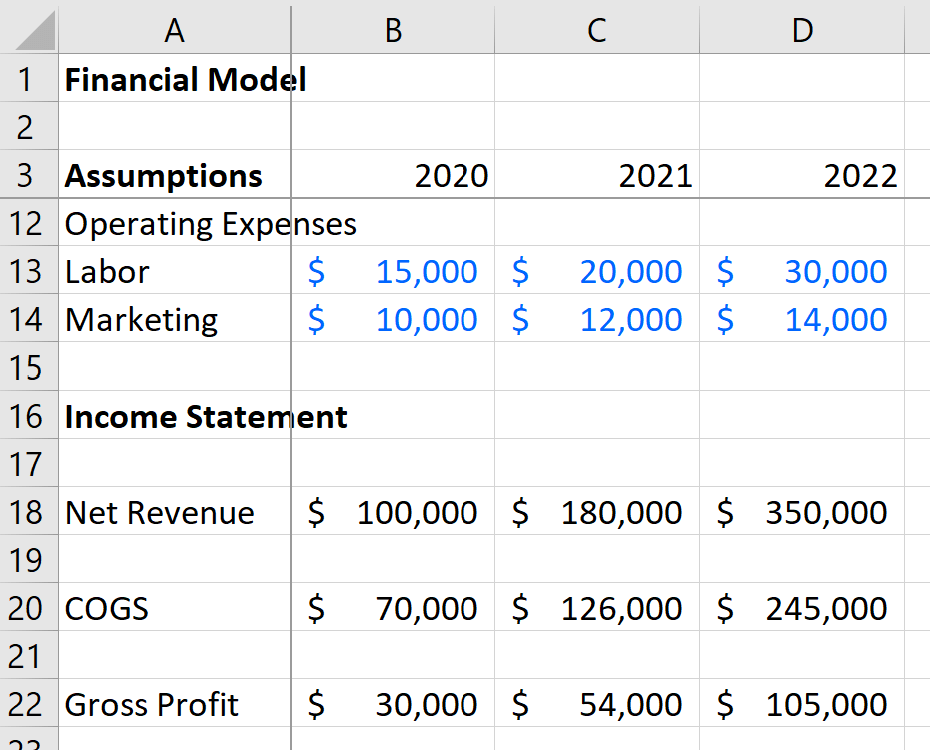
7. Still within the income statement area, calculate gross profit by subtracting COGS from net revenue (=B18-B20 in our example). Copy and paste the formula to the next two cells to the right. Check the formulas and the number formatting for the correct column and “accounting.”
Here’s our model at this point:
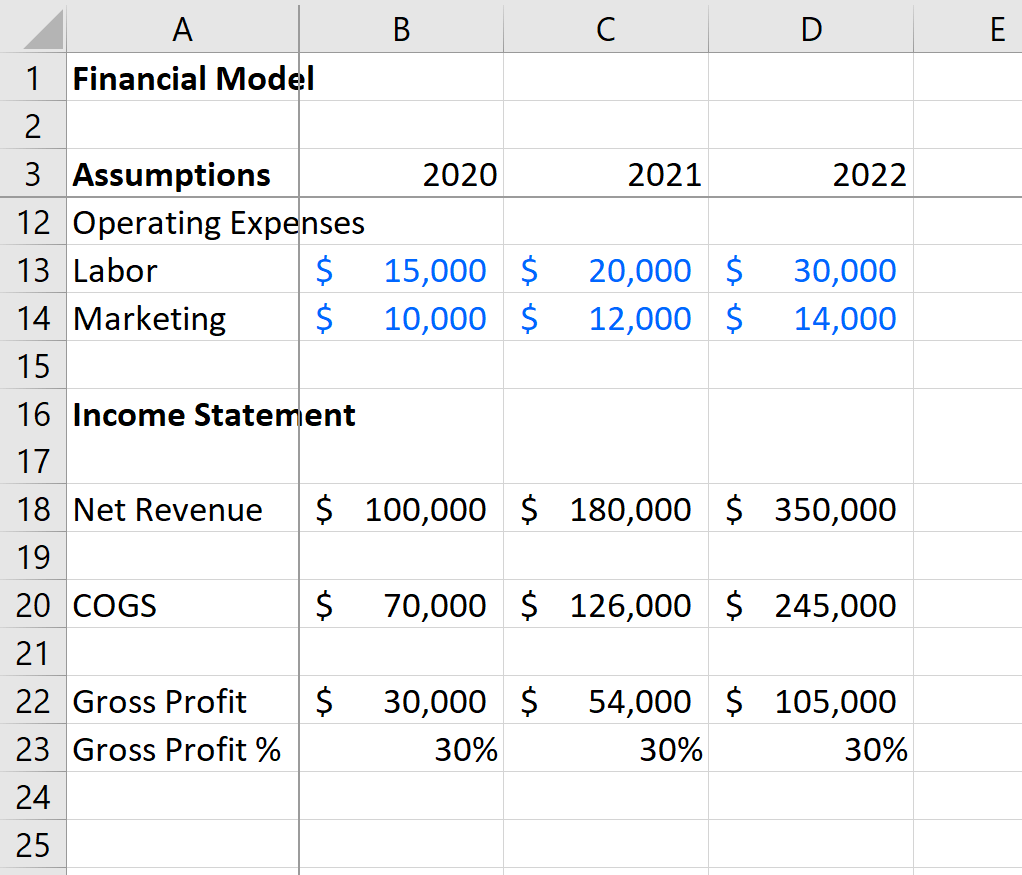
8. If you would like to see margins, you can divide the gross profit by revenue (=B22/B18) and change the number format to percentage so you get this result:
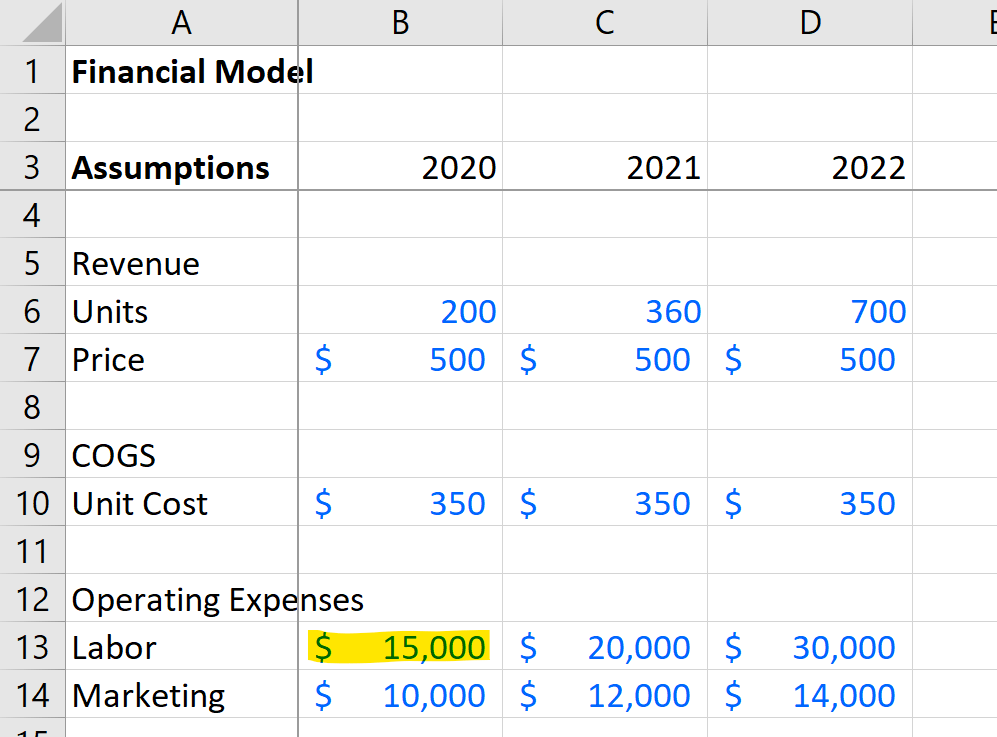
9. While still within the income statement, calculate operating expenses. For our sample, this included labor and marketing in our assumptions, and we will reflect those same expenses in the income statement. Remember that you don’t want to enter the same value in two cells, so fill in these cells by using a formula to pull numbers from the source in the assumptions. In this example, we would compute labor for 2020 by entering =B13 because we got that number from the assumptions. If we change the assumption later, the income statement will adjust along with it. Repeat this step for the remaining five cells in the operating expenses section of the income statement. Check your number formatting.
Remember our source for operating expenses assumptions here:
10. Calculate the total for operating expenses by adding all of the costs in this section together. In our case, we can simply add labor and marketing, but if you have more than two items here, you can use the sum formula. As always, check the number formatting.
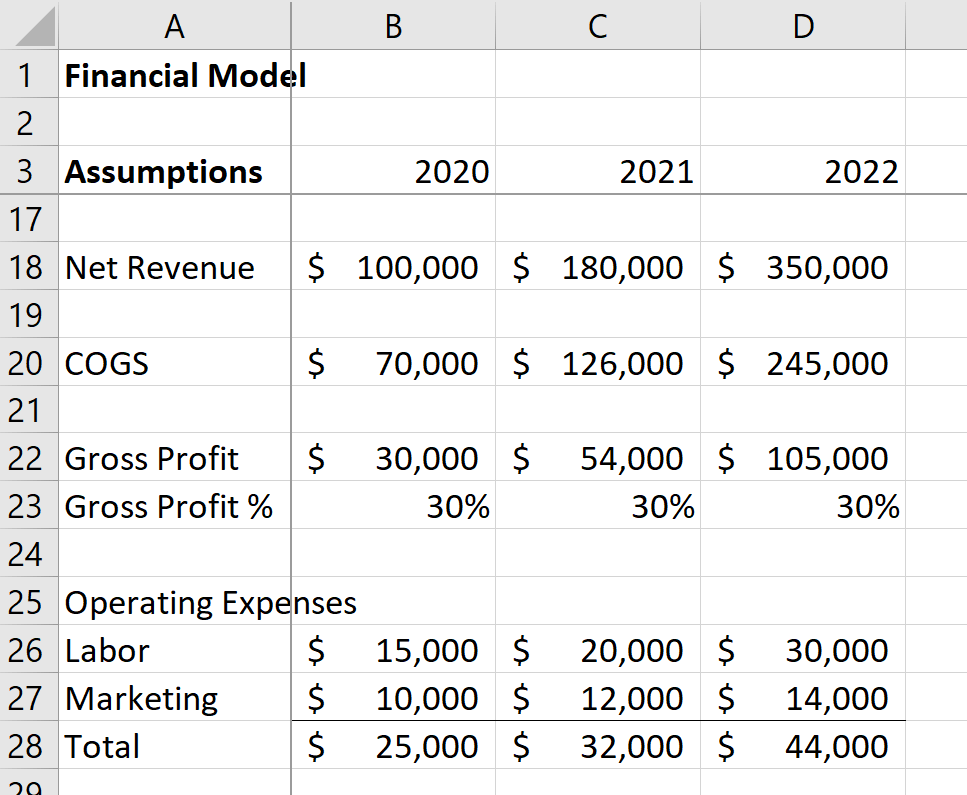
11. Calculate operating income by subtracting operating expenses from gross profit (=B22-B28). Copy and paste the formula in the cells to the right. Check your formula and number formatting.
12. Determine operating income margins by dividing operating income by revenue (=B30/B18). Again, copy and paste the formula for the next two years, and check your formulas and change the number format to “Percentage.”
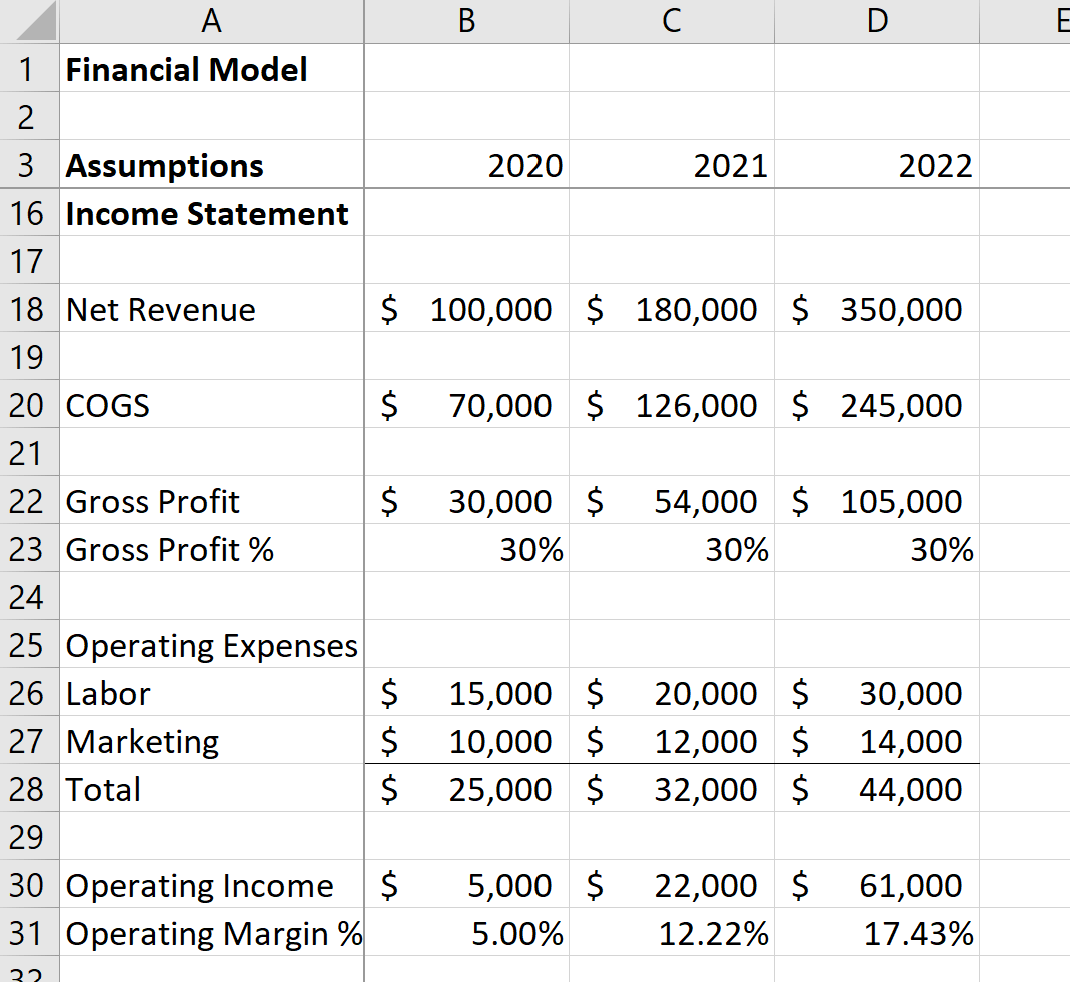
Now you have built a simple but dynamic model using best practices that automatically calculates gross and operating margins as you change assumptions. This is one of many models that can help you set goals and make decisions for your company.


