
Manufacturing companies can optimize their operations by understanding key performance indicators (KPIs) and strategies to optimize them. This guide lists the most useful manufacturing metrics and KPIs for the industry. Learn which measurements can help your business, how to monitor them with dashboards, and take data-driven actions to improve performance and guide your industrial transformation.
This article covers the following topics:
- 78 top manufacturing metrics and KPIs to monitor
- Guidelines for choosing the most impactful KPIs
- Examples of actionable manufacturing dashboards
What Are Manufacturing Metrics?
Manufacturing metrics measure and compare the performance of production processes. They provide useful data to manage production activities over time and can be used to support KPIs.
What Are Manufacturing Key Performance Indicators?
Manufacturing KPIs are quantifiable measurements that evaluate production processes against specific business objectives. Manufacturers use these figures as an objective way to track performance, identify inefficiencies, and develop data-driven improvement strategies.
While many companies use KPIs to track business health, manufacturing-specific indicators focus on targeted measurements, such as production efficiency, quality control, equipment effectiveness, and supply chain performance. These specialized metrics help managers and business leaders identify bottlenecks in production workflows to inform decisions that aim to reduce material waste, optimize resource allocation, and align manufacturing operations with broader goals. Manufacturers typically monitor these indicators over time to add historical context to their data and identify trends. Continuous improvement initiatives help manufacturers maintain their competitive advantages, even as new technology and practices enter the market and production grows increasingly complex.
Key Takeaways
- Manufacturing metrics and KPIs demonstrate challenges and success across manufacturing operations.
- Industrial transformation is necessary to compete across all manufacturing verticals.
- Consider using SMART (specific, measurable, actionable, realistic, and time-based) goals when defining metrics and KPIs.
What is the Difference Between a KPI and a Metric?
Though often used interchangeably, metrics and KPIs are distinct but closely connected terms. Metrics are fundamental data points about processes or activities, such as units produced or machine run times. KPIs are a carefully chosen list of metrics that businesses use as strategic indicators by directly tying them to predetermined targets. For example, a manufacturer’s units produced per hour starts as a simple metric that tracks production output but becomes a KPI when managers use it to measure and adjust their hourly output to reach a specific objective—say, a 150-unit goal to help the company achieve 15% quarterly revenue growth.
While manufacturers typically record numerous metrics throughout their day-to-day operations, especially those that use software with automated data collection tools, decision-makers often prioritize and regularly revisit a small set of key KPIs. This curated list provides department managers and leaders with the detailed information they need to identify actionable improvements and make strategic decisions in line with their long-term goals.
Why Use Manufacturing Specific Key Performance Indicators?
World-class manufacturing companies use KPIs to improve speed and quality while reducing costs. Using digital technologies to focus on incremental changes is a best practice that improves operations. This strategy is sometimes referred to as industrial transformation.
A key enabler of today's digital manufacturing evolution is the use of enterprise manufacturing intelligence (EMI). ERP platforms with advanced manufacturing features automate and unify disparate manufacturing and enterprise data for real-time analysis displayed with interactive dashboards.
By taking a data-driven approach to operations through real-time KPIs and dashboards, manufacturers can focus on quality, flexibility, and efficiency.
Guidelines for Manufacturing Key Performance Indicators
To get the most impact, businesses should focus on metrics that measure, analyze, and track performance based on business goals. Focus on KPIs that encourage your business to improve process speed and quality, enhance customer experience, and do more with less.
Consider the following guidelines when identifying and defining manufacturing metrics:
- Clearly defined goals: What is your organization trying to accomplish? Align manufacturing goals with overall business objectives, such as improving the quality of product provided or boosting output. Choose metrics that demonstrate when you achieve these goals.
- Accurate way to measure progress: Is the metric actionable? Follow the SMART (specific, measurable, actionable, realistic, and time-based) guidelines for setting goals, then collect data and track progress toward those objectives.
- Clearly defined data source: What data is accessible? Once you define your SMART metrics, use your ERP solution to capture the information you need in real time. Having the most accurate, dependable data will give management the reporting and metrics necessary for informed decisions.
- Efficient reporting method: Consolidated, configurable, and easily accessible dashboards are ideal for providing the right information at the right time to the management team and stakeholders.
- Aligns with the company’s business objectives: Select manufacturing KPIs that directly support current initiatives, such as increasing sales to grow market share or reducing lead times to improve customer satisfaction. By selecting the right KPIs, businesses can monitor the impact of production pivots and make adjustments as priorities change.
- Provides actionable insight: Choose KPIs that not only highlight performance issues but also point toward potential solutions. For example, the overall equipment effectiveness (OEE) KPI can be tracked by its components (availability, performance, and quality) to reveal the root causes of production slowdowns. This focused analysis enables teams to take targeted actions rather than make broad changes that only address symptoms of a deeper issue.
5 Top Manufacturing KPIs to Monitor Success
18 Top Manufacturing Key Performance Indicators
What are KPIs in manufacturing? Manufacturing KPIs help you assess productivity, quality, customer satisfaction, and profit. You can use varying KPIs to analyze and improve operations across your production lines.
-
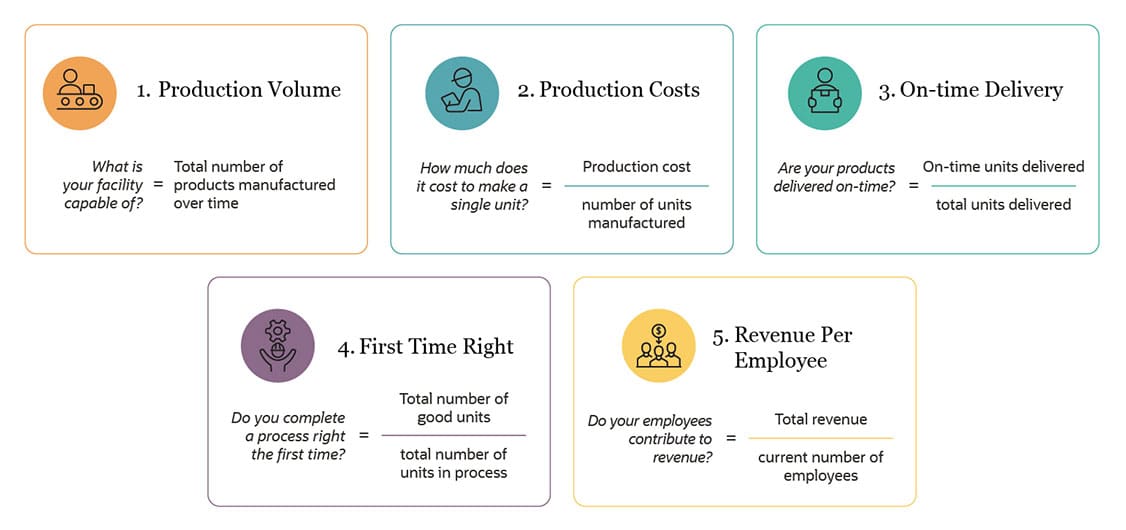
Production Volume
Production volume measures how many units are manufactured during a specified time frame. Production volume is fundamental for benchmarking manufacturing efficiency. Use this KPI to understand your factory’s total potential produced output your factory.
Production volume = Total # of products manufactured during a specified time frame
-
Production Downtime
Production downtime measures how long a factory’s production lines are not operating. It covers both planned and unplanned downtime. Minimize and control the amount of downtime to boost productivity.
Production downtime = Sum of all downtime during a specified time frame
-
Production Costs
Production costs include all the expenses incurred from manufacturing a product. They include both direct costs, such as raw materials and labor, and indirect costs, such as rent and overhead.
Production costs = Direct labor cost + Direct material cost + Overhead costs
Per-unit product cost = Production cost / Number of units manufactured -
Overall Equipment Effectiveness (OEE)
What is OEE in manufacturing? OEE is the percentage of time your plant is productive or manufacturing high quality products as quickly as possible with no downtime.
Overall equipment effectiveness (OEE) = Performance x Quality x Availability
Express OEE as a percentage and calculate it with the following dimensions:
- Availability: The actual production time as a percentage of scheduled time to operate.
- Performance: The percentage of time your machine or plant is working at full capacity.
- Quality: The quality units produced as a percentage of all the units started.
OEE only considers how long a line operates compared to its theoretical maximum potential. However, individual calculations should also factor in necessary maintenance. If the equipment is down and not scheduled for work, ignore this time in the availability calculation. Plant managers commonly use this KPI as a benchmark to compare similar production assets’ overall performance to see if plant operations are running effectively. OEE is also used as a standard baseline to track progress in eliminating waste as part of continuous process improvement initiatives.
-
Overall Operations Effectiveness (OOE)
This measure is similar to OEE, though it differs when considering availability. With equipment effectiveness calculations, the availability calculation does not include time for machine maintenance. However, OOE does include maintenance time in the availability calculation.
Overall operations effectiveness (OOE) = Performance x Quality x Availability
The following are expressed in percentages.
- Availability: The actual production time as a percentage of the total possible operation time, including maintenance.
- Performance: The percentage of time your machine or plant is working at full capacity.
- Quality: The quality units produced as a percentage of all the units started.
-
Total Effective Equipment Performance (TEEP)
Use this metric to gauge utilization. TEEP compares your plant’s performance in relation to potential output if it theoretically ran 24/7 for 365 days a year while always producing quality products.
Total effective equipment performance (TEEP) = Performance x Quality x Availability
The following are expressed in percentages.
- Availability: The actual production time as a percentage of total time if the plant were running for 24 hours a day, 365 days a year.
- Performance: The percentage of time your machine or plant is working at full capacity.
- Quality: The quality units produced as a percentage of all the units started.
-
Capacity Utilization
Capacity utilization measures how much of a plant’s total available capacity is in use. This KPI assesses efficiency and as an indicator of future growth opportunities.
Capacity utilization = (Total capacity used during a specific time frame / Total available production capacity) x 100
-
Defect Density
Defect density is a quality metric that tracks the number of defective products compared to the total volume of manufactured products. Defects can negatively impact profitability and cause customer satisfaction problems.
Defect density = # of defective units / Total units produced
-
Rate of Return (ROR)
Rate of return is a financial measure of how well a capital expenditure or investment performs over time. Expressed as a percentage, ROR accounts for the profit or loss realized from an investment over a period.
Rate of return (ROR) = (Current value – Initial value / Initial value) x 100
-
On-Time Delivery
On-time delivery quantifies the percentage of products delivered on time to customers compared to the total volume of delivered products. Use this to determine how well you’re meeting customer demand (a bellwether of customer satisfaction).
On-time delivery = On-time units delivered / Total delivered units
-
First Time Right (FTR)
First time right is a measure of a Six Sigma goal to complete processes right the first time, every time. This simple, albeit important, metric helps plant managers work toward efficient and lean production operations.
First time right (FTR) = Total # of good units / Total number of units in process
-
Inventory Turns
A key inventory management metric, this KPI examines the usage and replacement rate of stock during a given period. Plant managers running lean manufacturing programs want to minimize inventories.
Inventory turns = Cost of goods sold (COGS) / Average inventory during a specified time frame
-
Asset Turnover
Asset turnover measures the use of equipment and other assets to drive revenue. A high asset-turnover ratio can be an indicator of efficiency. Ideal turnover rates will vary by industry. For example, KPIs for the food and beverage industry making perishable items will be different from other manufacturers making durable goods.
Asset turnover = Net sales / Average total asset value
-
Unit Costs
Unit costs, otherwise known as cost of goods sold (COGS), is how much on average it costs to manufacture one product unit. Use this KPI to discern if your company produces goods efficiently.
Unit Costs = Variable costs + Fixed costs / Total units produced
-
Return on Assets (ROA)
Return on assets measures your company’s profitability in relation to its available assets. This KPI indicates the ability to use assets to drive revenue.
Return on assets (ROA) = Net income / Average value of total assets
-
Maintenance Costs
Maintenance costs include all the expenses incurred (both preventive and corrective) to maintain and repair production equipment. Use this KPI to monitor a machine's performance over time. The goal is to optimize equipment availability at minimal cost.
Maintenance cost per unit = Total maintenance costs in a specific time frame / # of products produced during the same time frame
Maintenance unit cost is the total maintenance expenses required to produce one product unit during a specified time frame.
-
Revenue per Employee
Revenue per employee measures how much revenue on average is generated per employee. Use this KPI to track employee benchmarks over time and against similar companies.
Revenue per employee = Total revenue in a given period / (# of full-time employee equivalents at beginning of period + # of full-time employee equivalents at end of period / 2)
-
Profit per employee
Similar to revenue per employee, this KPI looks at the amount of profit generated on average per employee. It’s a good measure of your organization's bottom-line profitability.
Profit per employee = Net income for a given period / (# of full-time employee equivalents at beginning of period + # of full-time employee equivalents at end of period / 2)
Efficiency Manufacturing Metrics
Manufacturing efficiency provides data on resource maximization and cost minimization. The goal is to produce many high-quality products at the lowest cost. Efficiency manufacturing KPIs focus on doing things the right way, without waste.
-
Throughput
Throughput measures the volume of product made over a specified time frame. Use this KPI to analyze and compare similar equipment, production lines, or manufacturing plants.
Throughput = Total number of good units produced / Specified time frame
For example, if 450 units were started and 400 good units were produced in an eight-hour shift, the throughput rate would be 400 units per eight hours, or 50 units per hour.
-
Work in Process
Work in process refers to goods that are in mid-production or waiting to be completed and sold. Work in process includes the raw materials, labor, and overhead costs associated with unfinished goods. This KPI can give you insight into how efficiently you’re using materials and the value of partially finished goods.
Work in process (WIP) = (Beginning WIP + Manufacturing costs) – Cost of goods manufactured
-
Overall Labor Effectiveness (OLE)
Overall labor effectiveness (OLE) measures productivity, evaluating how a business is leveraging its labor force. Similar to OEE for equipment, OLE tracks three aspects of labor: availability (percentage of scheduled time spent actively working), performance (percentage of target output reached), and quality (percentage of goods produced without defects). Managers use this metric to improve how they use their workers, informing new training, process designs, and deployment strategies.
Overall labor effectiveness (OLE) = Performance x Quality x Availability
-
Schedule or Production Attainment
Schedule attainment compares the number of manufactured goods to planned output.
Schedule attainment = (Actual production output in units / Target production output in units) x 100
-
Scrap Material Value
Scrap material represents the excess material left over after a product is complete. Scrap material is typically unusable but often sold as is.
Scrap material value = Amount earned on disposing scrap material – Disposal cost
-
On Standard Operating Efficiency
When using piece rate or incentive systems, measuring actual performance against estimated labor costs involved with costing products is called the on standard operating efficiency. This can help you keep an eye on labor costs and adjust product pricing or look for more efficient processes to lower production costs.
On standard operating efficiency = # of products produced at or below estimated costs in a given period / Total # of products produced in the same time frame
-
Asset Utilization
Also known as average return on assets, asset utilization looks at how efficiently you’re using your assets in production.
Asset utilization = Revenue in a given period / (Value of assets at beginning of period + Value of assets at the end of period / 2) x 100
Cost & Profitability Manufacturing Metrics
Financial and profitability KPIs help you to better understand product costs.
-
Total Manufacturing Cost per Unit Excluding Materials
Aside from sourcing materials at a lower price, companies can improve efficiency by digging into and tracking labor and overhead costs.
Total manufacturing cost per unit excluding materials = (Total manufacturing costs – Cost of materials) / Total number of units manufactured
-
Manufacturing Cost as a Percentage of Revenue
Manufacturing cost as a percentage of revenue compares the total production costs to revenue. Use this KPI to compare similar production assets and identify areas of possible cost savings.
Manufacturing cost as a percentage of revenue = Total manufacturing costs / Overall revenue
-
Net Operating Profit
Net operating profit measures profitability and can apply to a plant, business unit, or company. Subtract the cost of goods sold, operating expenses, interest, and taxes from revenue to obtain the net operating profit.
Net operating profit = (Revenue – Operating expenses) – Interest and taxes
-
Productivity in Revenue per Employee
Revenue can be an important measure of productivity. Use this KPI for a specific plant, business unit, or for a companywide metric.
Productivity in revenue per employee = Total revenue / Total employees
-
Average Unit Contribution Margin
How much profit is each unit generating? A product’s contribution is the amount of remaining money available to cover fixed costs after accounting for all unit variable costs. Use this business performance metric to identify poorly performing product lines.
Average unit contribution margin = (Total revenue – Total variable costs) / Total volume of production
For example, if total revenue minus total variable costs was $100,000, and 10,000 units were produced in that time, the average profit contribution margin would be $10 per unit.
-
Return on Net Assets (RONA)
Return on net assets (RONA) calculates the percentage of net income generated by your company’s assets. It evaluates how well your organization leverages its available assets to create profitable operations.
Return on net assets (RONA) = Net income / (Value of fixed assets + Net working capital)
RONA highlights how an organization employs its fixed assets—including equipment and raw materials—to grow revenue.
-
Energy Cost per Unit
Energy cost per unit measures how much energy it takes to manufacture each unit. The cost of energy impacts the profitability of product lines.
Energy cost per unit = Sum of all energy costs / Number of units manufactured
-
Contribution Margin Ratio
The contribution margin ratio calculates the percentage of a business’s revenue left after paying variable costs, including COGS. A higher ratio indicates a larger share of revenue can go toward generating profits and paying fixed costs, such as production facility rent, insurance, and administrative salaries. Operations managers often calculate this ratio for different product lines to maximize profitability when setting production priorities and prices.
Contribution margin ratio = (Revenue – Variable costs) / Revenue x 100
-
Cash-to-Cash Cycle Time
Cash-to-cash cycle time calculates the time needed to convert your investments in inventory to cash flow from receiving payment for selling your product.
Cash-to-cash cycle time = (Days inventory outstanding) + (Days sales outstanding) – (Days payables outstanding)
-
Earnings Before Interest, Taxes, Depreciation, and Amortization (EBITDA)
EBITDA is a popular measurement investors use to compare companies. An alternative to net earnings, EBITDA can help you gauge operational profitability.
EBITDA = Net income + Interest + Taxes + Depreciation + Amortization
-
Projected Customer Demand
Projected customer demand is a forecasting method that accounts for historical data and current market conditions to make predictions about future demand. Use data to inform the estimates and optimize your supply chain. Forecasting inventory and finding the right amount to have on hand to meet customer demand without paying high storage costs can be tricky. The right ERP tools can help you move beyond guesswork with historical trends, automated reorder points, and managing safety stock and cycle counts.
An important factor for projected customer demand is understanding reorder points.
Reorder point = (# units used daily x # Days lead time) + # units safety stock
-
Employee Turnover
A high attrition rate can impact your bottom line. Recruiting, onboarding, and training new employees can be timely and expensive. Keep an eye on employee turnover rates to see if adjustments need to be made to encourage employees to stay with your company and boost employee engagement, such as improving company cultureor offering training and career development.
Employee turnover = [# of separations in a given period / (# of employees at start of period + # of employees at end of period / 2)] x 100
Manufacturing Compliance Metrics
These KPIs monitor business, financial, legal and reputational risks. They also account for employment law with health, safety, and environment metrics, as well as product safety and consumer data privacy.
-
Reported Health and Safety Incidents
Reported health and safety incidents metric records the number of safety and hazard incidents that require reporting to the Occupational Safety and Health Administration (OSHA) over time.
Reported health and safety incidents = # of health and safety incidents reported to OSHA during a specified time frame
-
Health and Safety Incidence Rate
Health and safety incidence rate is the number of work-related injuries per 100 full-time workers during a 12-month time frame. It’s also referred to as the total case incident rate (TCIR).
Health and safety incidence = (# of OSHA-recorded injuries and illnesses x 200,000*) / total employee hours worked
*Note: 200,000 = 100 employees working 40 hours per week, 50 weeks per year
-
Reportable Environmental Incidents
Reportable environmental incidents records the number of issues your company must report to the Environmental Protection Agency (EPA). These incidents may relate to air and water, recycling, or other issues.
Reportable environmental incidents = # of environmental incidents reported to the EPA during specified time frame
-
Number of Non-Compliance Events per Year
Managers must document the time, reason, and resolution of all non-compliance events, and this metric tracks the number of times a manufacturing plant did not comply with guidelines during a 12-month period.
Number of non-compliance events per year = # of non-compliance events during a 12-month period
-
Failed Audit Rate
Every organization should plan and execute regular safety audits for all areas of your manufacturing plants and equipment. Track how often the operations are up to compliance standards.
Failed audit rate = # of failed audits in a given period / total # of audits conducted in the same period
Maintenance Manufacturing Metrics
These metrics look at the success of maintenance programs in improving equipment performance, increasing uptime, and reducing costs. They also account for availability of production line equipment.
-
Maintenance Unit Cost
Monitor the maintenance cost of equipment in relation to the number of units produced. The metric includes all costs to maintain and repair equipment to ensure its reliable operation. Use this KPI to monitor a machine's success over time.
Maintenance unit cost = Total maintenance costs in a specified time frame / # of products produced during the same time frame
-
Mean Time Between Failure (MTBF)
MTBF calculates the average time between equipment failures, such as an issue with a conveyor belt or industrial valve. This metric gives insight into the reliability of your production assets.
MTBF = Operating time in hours / # of failures
-
Mean Time to Failure (MTTF)
MTTF is a similar metric to MTBF. This metric considers non-repairable components, such as electronics or circuit breakers, that require replacement when they fail.
Mean time to failure (MTTF) = Operating time in hours / # of failures
-
Percentage Maintenance Planned (PMP)
Compare the total number of hours your organization spends repairing and maintaining production machinery with the time you expect will be needed.
Percentage maintenance planned (PMP) = (# of planned maintenance hours / # of total maintenance hours) x 100
-
Percentage Planned vs. Emergency Maintenance Work Orders
This KPI determines how much of your equipment maintenance is planned versus how much is due to emergencies? Unplanned maintenance is disruptive to workers and customers.
Percentage planned vs. emergency maintenance work orders = (# of planned maintenance hours / # of unplanned maintenance hours) x 100
For non-critical equipment or components, plant managers often employ a corrective maintenance strategy to repair equipment following an unplanned downtime event.
-
Unscheduled Downtime
Unscheduled downtime measures how long equipment is scheduled to perform but can't because of reliability or equipment issues. Unscheduled downtime can result in lost customers and revenue. It's a good way to scrutinize the success of your maintenance plans.
Unscheduled downtime = Sum of all unscheduled downtime during specified time frame
-
Downtime in Proportion to Operating Time
Expressed as a ratio, this metric looks at how much time equipment is unavailable for any reason in relation to how much time equipment is in operation.
Downtime in proportion to operating time = Total time equipment is down: Total time equipment is in operation
-
Avoided Costs
Avoided costs are realized savings due to preventive maintenance activities. By spending time and money on maintaining your equipment, you stop costly repairs and prolonged unscheduled downtime from occurring.
Avoided costs = (Assumed repair cost + Production losses) – Preventive maintenance cost
-
Machine Set-Up Time
Machine set-up time is the amount of time needed to prepare equipment ready for its next production after completing a run.
Machine set-up time = Time required to prepare machine for next run
Customer Experience & Responsiveness Manufacturing Metrics
Keep an eye on these metrics to track and optimize the customer experience. Manufacturing plays a pivotal role in on-time delivery of high-quality products, which are key components of an exceptional customer experience.
-
On-Time Delivery to Commit
On-time delivery to commit measures how often manufacturing can meet commitments for product delivery. This KPI tracks the efficiency of production lines and the success rate of meeting product schedules.
On-time delivery to commit = # of products delivered on time / Total number of products delivered
-
Lead Time
Lead time measures the total time it takes for customers to receive orders after they're placed.
Lead time = Order process time + production lead time + Delivery lead time
-
Customer Fill Rate
Keep an eye on the fulfillment of customer demand through existing product inventory. This KPI indicates how well the organization can meet consumer demand at any given time.
Customer fill rate = (# of orders delivered / # of orders placed) x 100
-
Customer Return Rate
How much of your business comes from repeat customers? This is a good way to monitor customer retention and loyalty.
Customer return rate = (# of return customers / Total # of customers) x 100
-
Customer Satisfaction
How can you know if customers are satisfied with the products you deliver? Start by asking them. Customer satisfaction surveys can tell you if customers are satisfied with your products and customer service, and if they’d recommend your company to others. One of the basic satisfaction metrics is gathered through a basic Likert scale asking customers how satisfied they are with your product.
Percentage of satisfied customers = (# of customers who said they were either very or extremely satisfied / total # of surveys filled out) x 100
Quality Manufacturing Metrics
These KPIs are leading indicators of production performance and measure defects across each stage of the production cycle.
How do you measure manufacturing quality? Quality KPIs, such as yield, perfect order percentage, and customer reject rate, assess how closely products meet their planned specs.
-
Yield
Yield is a measure of the overall volume of products manufactured compared to the input of raw materials. This does not account for process inefficiencies such as rework or scrap.
Yield = (Actual # of products manufactured / Theoretical number of maximum possible yield based off raw materials input) x 100
-
First Time Yield
First time yield measures the level of product quality and represents the number of non-defective products released without requiring wasteful rework. Use this KPI as a leading indicator of potential manufacturing issues such as material quality or equipment.
First time yield = # of non-defective or good units / Total # of products manufactured
-
Cost of Poor Quality (COPQ)
Cost of poor quality (COPQ) shows the total financial impact of quality-related issues throughout the manufacturing process. This includes internal failure costs like scrap, rework, and machinery malfunctions, as well as external costs, such as service calls, returns, and warranty claims. A low COPQ often implies high quality and reliable operations. Manufacturers use COPQ alongside other KPIs—like cost of good quality, which includes indirect quality expenses, such as appraisal and prevention costs—to assess the impact of quality improvement initiatives and identify and address the costliest quality issues.
Cost of poor quality = Internal failure costs + External failure costs
Alternatively, some businesses take a simpler approach when calculating COPQ by simply subtracting the minimum expected costs from final costs after completing a production run.
-
Rework Rate
Rework rate measures the share of products that require additional steps beyond the standard manufacturing process to meet quality standards. High rework rates not only point to higher production costs from additional labor, materials, and equipment usage, but also extended order fulfillment times from disrupted production schedules. By tracking this metric over time and across different production stages, manufacturers can better locate the source of any machinery problems or design flaws that lead to defects and diverted resources that could have gone to new orders.
Rework rate = (Number of reworked units / Total number of produced units) x 100
-
Rejection Rate
Rejection rate tracks how many finished products, relative to total units, fail final quality inspections and therefore cannot be shipped to customers. Unlike rework rate, which focuses on “fixable” goods, rejection rate focuses instead on complete failures at the end of the production cycle—sunk costs that cannot be recovered through sales. Manufacturers use rejection rates to identify recurring quality issues, allowing them to implement targeted improvements in procurement, quality control, and production processes. Businesses with high rejection rates often experience inventory shortages, delayed shipments, higher waste, and increased production costs that directly reduce profitability and sustainability.
Rejection rate = (Number of units rejected / Total number of units inspected) x 100
-
Perfect Order Percentage
How many complete orders are shipped on time as a percentage of all orders? This KPI tracks the volume of orders shipped without incidents such as late delivery, damaged products, or missing items.
Perfect order percentage = (Percent of orders delivered on time) x (Percent of orders complete) x (Percent of damage-free orders) x (Percent of orders with accurate documentation) x 100
Use this KPI to evaluate if order capture, order management, manufacturing, and fulfillment processes are aligned.
-
Return Merchandise Authorizations (RMA)
Measure how often customers are dissatisfied and request and receive a refund for returned goods.
Return merchandise authorizations (RMA) = (# of RMAs / # of orders delivered) x 100
-
Customer Reject Rate
Customer reject rate measures how many parts delivered to customers are defective. Products can have more than one part to them, and this drills down to look at how many specific parts are rejected by customers.
Customer reject rate = (# of rejected parts / Total # of parts in all products shipped) x 100
-
Supplier's Quality Incoming
An important KPI for your supply chain, this metric examines the quality of raw materials from suppliers.
Supplier's quality incoming = # of quality raw materials received / Total # of incoming materials
-
Scrap Rate
Scrap rate measures the volume of discarded materials during manufacturing. Minimizing the amount of scrap produced in your manufacturing can represent cost savings by increasing efficiency of raw material usage. Additionally, scrap materials can be labor- and time-intensive to sell, recycle, or dispose.
Scrap rate = Amount of scrap material produced during a manufacturing job / Total materials intake or put into the process
Lean Manufacturing Metrics
How do you measure manufacturing efficiency? Lean manufacturing KPIs are metrics that examine and help you improve process efficiency. Use lean KPIs to identify opportunities where you can reduce waste and increase speed.
-
Cycle Time
How long, on average, does it take to complete a customer order? Cycle time helps you understand how prepared your business is to meet customer demand.
Cycle time = (Time customer received order – Time customer placed order) / # Total shipped orders
-
First Pass Yield
First pass yield is a vital product quality measurement that represents the number of non-defective products built without requiring rework. Use this KPI as a leading indicator of issues in the manufacturing process.
First yield pass = # of non-defective products built the first time with no rework required
-
Machine Downtime Rate
Machine downtime rate is how long equipment is unavailable to manufacture products. Machine downtime includes planned and unplanned downtime for scheduled maintenance for equipment failure.
Machine downtime rate = Total uptime / Total uptime + Total downtime
-
Material Yield Variance
Material yield variance is the delta between the amount of material used and the standard.
Material yield variance = (Actual unit usage – Standard unit usage) x Standard cost per unit
-
Overtime Rate
Overtime rate measures the excess hours employees work beyond normally scheduled working hours.
Overtime rate = (Overtime hours / Total hours worked, including overtime) x 100
Performance Metrics
How do you calculate production KPIs? Manufacturing performance or production metrics track the success of each step of production. These include production attainment, changeover time, and takt time.
-
Production Attainment
Production attainment measures manufacturing's ability to meet its target production level. The higher the score, the better the performance.
Production attainment = (Actual production / Scheduled production) x 100
-
Changeover time
Changeover time is the duration needed to transition a production line from one product to another product.
Average changeover time = Total time to changeover production lines / # of changeovers
-
Takt Time
Takt time is how fast you need to complete a product to meet demand. Calculate this KPI by dividing customer demand by available production time.
Takt time = Total available production time / Average customer demand
Manufacturing Innovation Metrics
Monitor and share these metrics to encourage creativity. Innovations may include new or updated products, and can leverage process improvement or even new technology, such as AI for manufacturing.
-
Rate of New Product Introduction (NPI)
The rate of new product introduction measures how often your company introduces new products. It is best to consider the NPI rate for new products taken to market.
New product introduction rate (NPI) = # of new products / New product introduction goals
-
Engineering Change Order Cycle Time
Change order cycle time measures the time it takes to finish a product from change order receipt to implementation. The measurement is most commonly based on the average number of days to achieve the change.
Engineering change order cycle time = Engineering change order cycle time in days, weeks, or months
-
Return on Innovation Investment (ROII)
ROII calculates the financial returns generated from new product development and process enhancements, relative to costs. This metric helps manufacturers evaluate the success of R&D investments and process improvement initiatives, giving decision-makers quantifiable assessments for potentially repeatable successes. Monitoring ROII for different initiatives allows companies to make more disciplined investment decisions to direct investments toward projects with greater potential while reducing resource drain by terminating underperforming investments.
Return on innovation investment (ROII) = (Net profit from investment / Total investment) x 100
-
Process Innovation Implementation Rate
Process innovation implementation rate measures how quickly and consistently a manufacturer implements process improvements across its organization within a specified timeframe. A high implementation rate implies an agile operation that rapidly adopts new methods. Conversely, a low rate may signal institutional barriers, such as resistance to change or poor project management.
Process innovation implementation rate = (Number of implemented process innovations / Total number of approved proposals) x 100
Monitoring Manufacturing KPIs
To implement the systematic data collection and visualization processes needed for effective KPI analysis, manufacturers often use real-time monitoring systems that capture information directly from equipment, quality stations, Internet of Things (IoT) devices, and enterprise systems. Then, these systems consolidate this data into customizable reports tailored to different stakeholders’ needs, thereby eliminating redundant and error-prone manual entry. Businesses should align their KPI reporting schedules with operational cycles—managers may track hourly equipment performance, for example, but review profitability reports at the end of every month. Establishing consistent review timelines and baseline performance levels for each metric helps manufacturers set realistic improvement targets and quickly identify any deviations before they impact production or customers.
KPIs are typically most useful in a larger context, rather than as standalone numbers. Therefore, modern analytics platforms come with built-in visualization features, such as easy-to-read trend graphs and color-coded indicators for metrics outside of acceptable ranges. This allows floor supervisors to take proactive steps, rather than waiting for lagging indicators (e.g. dropping customer satisfaction levels or sluggish cash flow). The most successful KPI analysis often involves collaborative technology, including cloud-based reporting and unified data formatting, to help cross-functional teams review metrics together and develop improvements in one area without negatively affecting performance in others.
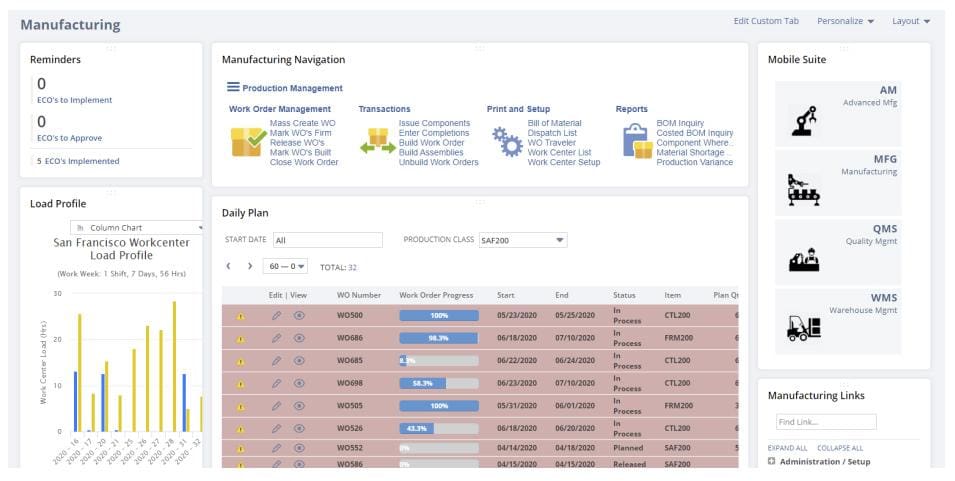
Manufacturing KPI Dashboards
A manufacturing dashboard consolidates the most critical KPIs into a central display so plant managers can monitor production data in real time. The dashboard’s inputs can come from many sources, including industrial IoT sensors and integrated manufacturing software that combines warehouse management, financial accounting, costing, and other features or modules.
Advanced data visualization techniques make the information easy to consume at a glance while also offering deeper data drill-downs through pre-built reports. Plant managers and staff use role-based manufacturing dashboards to monitor the health of operations, correct process inefficiencies, minimize costs, and optimize opportunities for quality and performance improvements.
NetSuite’s Manufacturing Dashboard
A manufacturing KPI dashboard may combine data on production efficiency, quality, and performance. The dashboard may show KPIs, such as OEE and customer satisfaction. This dashboard gives you real-time insight into meaningful data to improve manufacturing process speed and quality and company profitability, including:
- OEE
- Customer satisfaction
- Production volume
- Reported health and safety incidents
- RONA
Production Performance Dashboard
A production performance dashboard may display real-time KPIs about equipment status and production. The dashboard may show KPIs related to volume, downtime, and cost, comparing actual versus planned for each metric. This dashboard gives you real-time analysis of equipment performance and its impact on production to optimize manufacturing volumes and throughput, including:
- Equipment downtime
- Idle time
- Run-time hours
- MTBF
- Percentage planned vs emergency maintenance work orders
- Downtime in proportion to operating time
Manufacturing Quality Dashboard
A manufacturing quality dashboard may compare total yield to first pass yield. The result will track defective production against the number of non-defective products built the first time correctly.
The dashboard may also include the customer return rate of faulty or incorrect product orders, the quality of incoming materials from suppliers, or other logistics KPIs. This dashboard gives you rapid insight into potential issues within the manufacturing process, such as material quality, labor inefficiencies, or equipment, including:
- Yield
- First pass yield
- RMA
- Rate of return
- Supplier's quality incoming
Manufacturing Cost Management Dashboard
Dashboards for manufacturing cost management display real-time KPIs on product costs and profitability. The dashboard may combine graphs and tables that depict unit, maintenance, and energy costs. They may also include asset turnover and average unit contribution margin.
With manufacturers seeking higher returns on invested capital, look to financial dashboards such as this to ensure you are maximizing profitability while complying with quality and safety standards. This dashboard displays metrics that include:
- EBITDA
- Cash-to-cash cycle time
- Total manufacturing cost per unit excluding materials
- Net operation profit
- Net return on assets
Lean Manufacturing Dashboard
Lean manufacturing dashboards monitor process efficiency. The dashboard may include data that tracks on-time completions or production against customer order shipment dates.
Lean dashboards may also look at anomalies or deviations that influence production output or equipment status. All manufacturing companies, regardless of size, can benefit from improving efficiency. And emerging and start-up manufacturers can establish successful and efficient protocols to make the most out of every dollar spent with the help of EMI platforms that monitor and display data in dashboards.
Use lean manufacturing dashboards to rapidly identify opportunities to eliminate waste from the manufacturing process and increase operations speed by displaying metrics such as:
- Cycle time
- Capacity utilization
- Machine downtime rate
- Overtime rate
How NetSuite Helps You Track Manufacturing KPIs and Metrics
Modern manufacturers need comprehensive and timely data to maintain an accurate view of performance throughout every aspect of their business. NetSuite for Manufacturing integrates production, inventory, finance, and customer information into one unified system, eliminating data silos and giving manufacturers visibility into company-wide operations. The platform’s manufacturing-specific dashboards provide real-time and targeted KPI analysis through customizable and secure role-based access. Furthermore, NetSuite’s automated and standardized data collection tools eliminate the manual processes that introduce errors and delays, creating consistency across departments.
Beyond data collection, NetSuite’s built-in analytics tools allow businesses to turn raw manufacturing data into actionable suggestions through customizable reports, often aided by visualizations that highlight trends, outliers, and improvement opportunities. With automated alerts based on preset KPI thresholds, NetSuite’s cloud-based system keeps all relevant users informed no matter where they are, unlocking faster decision-making and more responsive operations management. Manufacturers can use this comprehensive approach to quickly identify and resolve production issues, building a more sustainable and profitable manufacturing operation, even as market conditions evolve.
Every manufacturer has a unique view of success and how they assess their performance should reflect their unique priorities and objectives. By curating a list of targeted performance metrics, businesses can directly connect their KPIs with their long-term strategies, gaining real-time insights into every decision’s impact on critical areas like profitability and market share. Consistent measurement practices, often aided by analytic tools and software, help businesses quickly identify production inefficiencies and take well-informed steps to resolve any problems before they escalate. As manufacturing operations continue to incorporate more digital technologies, these metrics become increasingly valuable, giving leaders an objective and data-driven way to validate process changes and build more resilient production systems that balance efficiency, quality, and flexibility to better meet ever-changing customer demand.
Manufacturing KPIs FAQs
How do you set a benchmark for a KPI?
To set an effective benchmark for a key performance indicator (KPI), first establish a baseline by measuring current performance, accounting for normal variations. Then compare this baseline against industry standards, historical data, and future goals to set ambitious, but realistic, targets. Finally, document each benchmark and communicate them to all stakeholders, adjusting them as real results come in.
Which KPIs measure manufacturing profitability?
Key performance indicators (KPIs) that measure profitability include net operating profit, average unit contribution margin, return on net assets, and manufacturing cost as a percentage of revenue. Energy cost per unit and cash-to-cash cycle time can also reveal inefficiencies in resource usage and working capital management that may be impacting profitability.
What three aspects do KPIs measure?
Manufacturing key performance indicators (KPIs) are diverse metrics, but most can be placed in three categories: efficiency (how the business uses its resources), effectiveness (how successfully outcomes are achieved), and quality (how closely outputs meet expectations).