Learn everything you need to know about key performance indicators (KPIs) in logistics. This article provides a list of essential KPIs by category, with formulas and example calculations. The step-by-step guide will help you build scorecards and dashboards so your business can realize the value of KPIs.
In this article:
- Logistics KPIs by category
- Do's and don'ts of creating logistics KPIs
- Logistics dashboards
- Logistics metrics scorecards
What Is Logistics?
Logistics is the process of procuring and bringing in goods, services and information. Logistics covers everything from purchasing to warehousing to fulfillment to transportation and delivery, and how resources are managed at each of those stages. Those resources may include people, raw materials, products and equipment a business counts on to keep its operations running smoothly. Learn how to streamline your logistics by reading this logistics primer.
Stages to Measure
Logistic stages divide the procedures within this business funciton into sections and can help you optimize operations. For example, you can measure KPIs tied to order management, supply, inventory, distribution and transport management to find ways to improve performance.
What Is Logistics Management?
Logistics management controls the procurement, movement and storage of goods. The process starts at the product's origin and ends with the consumer. Logistic management also includes order fulfillment and integrates with other business functions.
Key Takeaways
- Logistics KPIs are essential for businesses to measure and improve their performance in various stages of the supply chain, from order management to transportation management.
- When setting up logistics KPIs, it's crucial to define specific, measurable, achievable, relevant, and timely (SMART) goals and focus on both leading and lagging indicators.
- Different stages of the supply chain require different KPIs. For example, order management KPIs focus on order accuracy and on-time shipping, while supply KPIs monitor lead time and capacity utilization.
- Warehouse and order management KPIs help optimize warehouse operations by measuring factors like order accuracy, inventory accuracy, and space utilization.
- Logistics metrics scorecards are useful tools for comparing a company's performance against industry benchmarks, and they can help identify areas for improvement in logistics operations, safety, and customer service.
Why Are Logistics KPIs and Metrics Important?
Logistics KPIs are a way for businesses to compare their own performance against industry benchmarks. By tracking KPIs, businesses have important data that enables them to improve operations. This data shows the mistakes and how to address them, reducing costs.
For example, one useful KPI in the warehouse is on-time shipping. This metric shows the percentage of shipments that departed the warehouse on-time. All shipments are on tight timelines, and late shipments can damage the customer experience and potentially cost businesses money. If on-time shipping is below the benchmark, that points to problems in the warehouse. Measuring on-time shipping is one step in understanding customer satisfaction.
How to Set Up Logistics KPIs
Set up KPIs for logistics by first defining your company's logistics goals. Ensure that the plans are SMART: specific, measurable, achievable, relevant and timely. Determine goals for both leading and lagging indicators.
Use the goals to identify the information you need from the KPIs. These answers help you adjust business processes and identify opportunities for improvement. For logistics, start with KPIs that answer the following questions:
- What is the percentage of promised deadlines missed?
- How many orders arrived damaged, by month?
- How often did customers receive the wrong order?
- How do out-of-stock items affect customer wait times?
- Is our shipping department maximizing its capacity?
Decide on a few key metrics that address these issues and make sense for your business model. New businesses should focus on facilitating a unique customer experience and getting feedback from buyers. Companies in mid-stage should pay attention to customer satisfaction, business recognition and monthly revenue. Established organizations should concentrate on churn rate and cost per acquisition.
What Are the KPIs in Logistics?
Businesses use logistics KPIs to identify stages in the flow of goods that need improvement. The relative importance of logistics KPIs vary by industry. Determine your business's standing in its sector and choose KPIs that are representative of it.
Break KPIs out by their stage within the supply chain. Pick a few KPIs in each stage that target your company’s position in the industry and potential for improvement. For example, the graphic below highlights some best-practice metrics for each stage in the logistics chain.
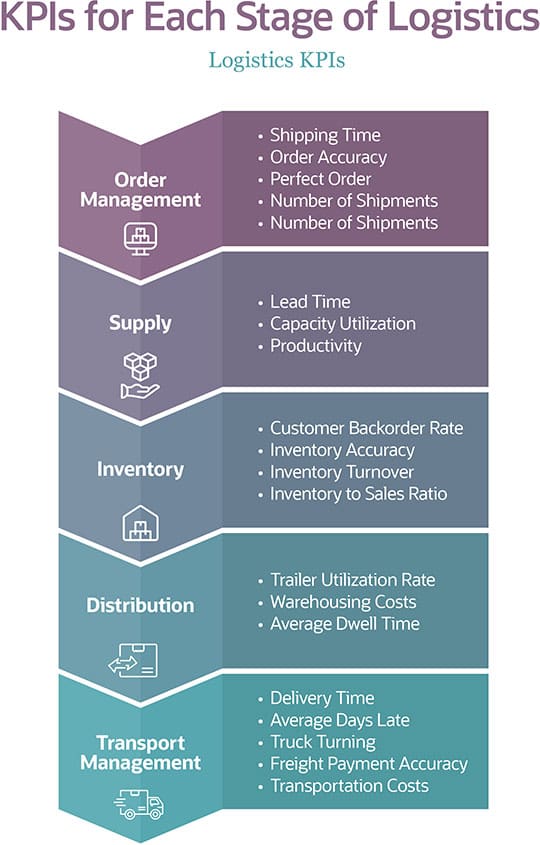
List of KPI Logistics
When organizing your logistics KPIs by stage, the stages may overlap a bit, but their activities and KPIs do not. The logistics metrics below are distinctive and reveal how well the business is functioning in each area.
Order Management KPIs
Order management KPIs focus on orders and returns processing, which are crucial for reverse logistics. These metrics start when customers place an order.
- Shipping Time: Shipping time is the length of time it takes for companies to ship an order on or before the requested date. This metric is vital to customer satisfaction. Organizations often couple it with the on-time shipping KPI.
- Order Accuracy: Order accuracy is the measure of inventory on-hand and order pick accuracy. Without high order accuracy, companies can suffer from slowdowns in production or sales, costing time and money.
- Perfect Order: Perfect order, also known as perfect customer order rate, is a KPI that measures how many orders ship without issues (damage, delays or inaccuracies). This metric is another KPI that targets customer satisfaction.
- On-Time In-Full: On-time in-full represents how many shipments are delivered according to the quantity and schedule specified when they were ordered. This is typically regarded as a customer-centric metric since it measures how often a customer gets what they ordered at the time it was promsed.
- Number of Shipments: The number of shipments is how many loads your company sent out in a given period. Looking at the averages of this KPI helps companies optimize their resources and hit their financial goals.
Supply KPIs
Supply KPIs are metrics that focus on how well final goods are moving through the supply chain. Use these measurements to help improve the efficiency of your operations and grow your business. They are also useful for developing acceptable practices and relationships with other supply chain partners. Learn more about supply chain management.
- Lead Time: Lead time, also known as order cycle time, is a measure of the time between when a customer places an order and when they receive it. This metric is vital for identifying possible bottlenecks.
- Capacity Utilization: Capacity utilization is how much of a resource a company is using. This resource can be the production of goods or professional services. This metric is essential for maintenance management and resource tracking.
- Productivity: Productivity is a measure of how well a company’s machines, departments and/or people are running. Measuring and understanding productivity helps businesses ensure they can deliver on their promises.
Inventory KPIs
Inventory KPIs can help measure the effectiveness of inventory purchasing and production processes, and may also focus on cash flow and productivity. Read the guide to inventory KPIs and metrics to learn more.
- Customer Backorder Rate: Customer backorder rate is how often a company cannot fulfill an order. This metric directly contributes to customer satisfaction.
- Inventory Accuracy: Inventory accuracy measures how closely your inventory records reflect what is actually in storage. This metric is vital for knowing what your company has in stock and forecasting inventory purchases.
- Inventory Turnover: Inventory turnover, also known as stock rotation, is the measure of how many times in a period a company sells all its stock of a certain product. Inventory turnover is important to retail success and keeping the company competitive. For more on inventory turnover, read the inventory turnover primer.
- Inventory to Sales Ratio: The inventory to sales ratio measures the amount of inventory in stock versus the number of fulfilled sales. As inventory is often a company’s biggest expense, businesses that can keep their inventory expenses low relative to their sales save money overall.
Distribution KPIs
Distribution KPIs focus on the system that manages product flow—moving a product to customers directly or from from distributors.
- Trailer Utilization Rate: Trailer utilization rate measures how well companies are loading their trailers. This rate reflects a company’s load planning and whether it is minimizing costs there as much as possible.
- Warehousing Costs: Warehousing costs are a group of metrics that cover the expenses specific to your warehouse. These can include any equipment, energy, labor, delivery and shipping costs that get goods into and out of the warehouse. Use this KPI to measure how efficient your warehouse operations are. Read the warehouse management system (WMS) guide to learn how it can improve costs.
- Average Dwell Time: Average dwell time, also known as wait time, is the length of time a carrier sits before processing for pickup and delivery. This metric indicates how well a facility functions. Shippers with low average dwell times will struggle to attract drivers and pay more in securing services.
Transport Management KPIs
Transport management KPIs govern the trucking of goods and can help improve operations. These metrics differ based on what entity needs the information. Because they affect the economy, federal agencies may also request these numbers.
- Delivery Time: Delivery time, also called on-time delivery, measures how quickly an order arrives in full. The time is for the entire order, not just parts. This metric impacts customer satisfaction and loyalty.
- Average Days Late: Average days late is the number of days between the delivery's due date and when the customer receives the order. This metric provides insight into the delivery process and also directly impacts customer satisfaction and loyalty.
- Truck Turning: Truck turning, also known as truck turnaround rate, is the time between when a delivery truck enters a facility to collect or deliver goods and when it exits. The smaller the truck turning rates, the more time the truck is on the road. This rate shows how well a company handles loading and unloading.
- Freight Payment Accuracy: Freight payment accuracy, also called freight bill accuracy, is the number of error-free freight bills compared to the total number of freight bills in a period. Freight bills are quite error-prone, yet data errors are incredibly costly.
- Transportation Costs: Transportation costs are the group of metrics that track an order’s price from beginning to end. This metric includes order processing, administration, inventory carrying costs, warehousing and transportation costs. Use these costs to see if your transit operations are efficient. See the transportation logistics guide and transportation logistic trends article to learn more.
18 Essential Logistics KPIs and Metrics
These 18 logistics metrics can help your business manage costs and improve customer satisfaction. These costs relate to shipping, distribution, transportation, warehousing and logistics performance. Use these KPIs to identify problems and optimize your processes.
Formulas for Transportation KPIs
-
Average Cost per Skid or Order: The average cost per skid or order is a combination of all the hidden and more obvious costs. The metric compares the number of skids or orders to the total cost of the shipment or effort. This measurement can help to identify skids or orders whose costs are unusually high.
Average Cost per Order Example: Bob's Hardware has the following costs for a new product:
Marketing campaign: $500
COGS: $1,200
Packaging: $50
Shipping costs: $200
Storage costs: $100
Number of orders: 300Average cost per order = (total in costs) / (total number of orders)
Average cost per order = ($500 + $1,200 + $50 + $200 + $100) / (300)
Average cost per order = $6.83In Bob’s Hardware scenario, the average cost per order is $6.83.
-
Average Transportation Cost: The average transportation cost is the average cost of transportation expenses compared to gross monthly income. This measures the distribution of the expenses from order placement to delivery. This includes actual transit costs and those for order processing, which is a small percentage of administration, inventory carrying and warehousing.
Average Transport Cost Example: A company has an $800 average monthly transportation cost and $10,000 monthly gross income
Average transport cost = Average transport cost / (monthly gross income) × 100
Average transport cost = ($800 / $10,000) × 100
Average transport cost = 8%This company spends about 8% of its monthly income on transportation.
-
Freight Cost per Unit Shipped: Freight cost per unit shipped is the total freight costs divided by the number of units shipped in the period. The measurement considers things like cargo mix and making sure the container is not underloaded. Companies want full container loads.
Freight Cost per Unit Shipped Example: $4,200 for 6,000 units
Freight cost per unit shipped = (Cost of freight) / (# units)
Freight cost per unit shipped = $4,200 / 6,000 units
Freight cost per unit shipped = $0.70 per unitIn this example, the freight was $.70 per unit in shipping.
Formulas for Supply KPIs
-
Transit Time to Distance: The transit time to distance compares the distance a shipment travels to the time it takes it to go from pickup to destination.
Transit Time to Distance Example: 5 days, 2,000 milesTransit time to distance = (time to go from pickup to destination) / (# miles)
Transit time to distance = 5 days / 2,000 miles
Transit time to distance = 0.0025 days/milesIn this example, the travel time to distance is 0.0025 days per mile.
-
Stock Rotation: Stock rotation, also known as inventory turnover, is the number of times a company sells its inventory in a period. This metric helps companies monitor aging stock.
Stock Rotation Example: Happy Company has $10,000 in sales and $5,000 in average inventory.
Stock rotation = Sales / Average inventory
Stock rotation = $10,000 / $5,000
Stock rotation = 20In this scenario, Happy Company sells through its stock 20 times in this period.
-
Out-of-Network Shipment: Out-of-network shipments are the unusual shipments ordered due to stock depletion. These shipments can be expensive. The ratio of out-of-network shipments compares them to total shipments.
Out of Network Shipment Example: There are 20 out-of-network shipments out of the 5,450 shipments in this period.
Out-of-network shipments = (total out-of-network shipments) / (total shipments) × 100
Out-of-network shipments = 20 / 5,450 × 100
Out-of-network shipments = 0.4%In this situation, 0.4% of shipments in this period were out-of-network.
Examples of Distribution KPIs
-
On-Time Final Delivery: On-time final delivery, also known as on-time delivery (OTD), is the ratio of products delivered on-time to customers compared to the total number of shipped products. The KPI measures supply chain efficiency and performance in delivery operations. The units shipped on-time is for the whole order, not broken down by piece.
On-Time Final Delivery Example: Of the 18 orders delivered this week, 15 were delivered in full, two partial deliveries and one order pending.
OTD = (Units delivered on-time) / (Total units) × 100
OTD = 15 / 18 × 100
OTD = 83%In this scenario, the company delivered 83% of products on-time. The goal of OTD is always 100%.
-
On-Time Pickup: On-time pickup is the number of pickups the freight carrier made on-time compared to the period's total shipments. This metric shows carrier performance, which boosts customer satisfaction and shipping efficiency. Experts recommend relying on documentation transit time, not on the carrier's data.
On-Time Pickup Example: This month, Happy Carriers picked up 43 shipments on time out of a total of 46 shipments.
On-time pickup = (# shipments picked-up) / (Total # shipments) × 100
On-time pickup = 43 / 46 × 100
On-time pickup = 93.5%In this example, the on-time pickup performance was 93.5%. Experts consider anything above 90% acceptable.
-
On-Time Shipping: On-time shipping is how close the carrier came to shipping out the order when promised. Measure the number of units shipped out on time compared to the number of units shipped during that period. Orders must be in-full to count toward this metric.
On-Time Shipping Example: Of the 23 orders shipped out on-time, 18 were in-full and on-time, three were partial orders shipped on-time and two were behind what the company promised.
On-time shipping = (# orders shipped on-time) / (Total # orders shipped) × 100
On-time shipping = 18 / 23 × 100
On-time shipping = 78.3%Using these numbers, the company shipped 78.3% of orders out on-time. The goal is always 100%.
Formulas for Warehouse and Order Management KPIs
-
Unplanned Shipment: The unplanned shipment, also known as the unplanned supply order lines, are the number of supply order lines not being shipped soon. The company has no plans to ship these products. This metric is the number of unplanned shipments compared to the total number of shipments.
Unplanned Shipment Example: Four unplanned shipments this month; 4,000 shipments completed this month
Unplanned shipment = (number of unplanned shipments) / (number of total shipments) × 100
Unplanned shipment = 4 / 4,000 × 100
Unplanned shipment = 0.1%In this example, this company has 0.1% of its shipments in unplanned shipment status.
-
Order Accuracy: Order accuracy, also known as order picking accuracy, is the number of orders picked and verified as accurate compared to the total number of orders picked for a period. This metric helps with process improvement in the warehouse.
Order Accuracy Example: Quality control verified 123 orders correct from the 128 picked today.
Order accuracy = (# order verified correct) / (# orders picked today) × 100
Order accuracy = 123 / 128 × 100
Order accuracy = 96%In this scenario, quality control staff verified that 96% of today's picks as accurate. Since this metric affects customer satisfaction, companies should work to make it as high as possible.
-
Inventory Accuracy: The inventory accuracy KPI is the accuracy of inventory in stock compared to what the database shows are in stock. This metrics shows the effectiveness of your bookkeeping methods and ensures there are no stockouts.
Inventory Accuracy Example: There are 3,458 items counted in stock; the system lists 3,506 items.
Inventory accuracy = (# items counted) / (# items system lists as present) × 100
Inventory accuracy = 3,458 / 3,506 × 100
Inventory accuracy = 98.6%This example shows that 98.6% of items are accurately in-stock. The metric does not differentiate between entities, just the number of overall items.
-
Dock-to-Stock: Dock-to-stock cycle time is how long it takes for a product to go from the start of its receipt to when it is put away and ready for sale compared to the total number of shipments received. Staff usually count this in hours.
Dock-to-Stock Example: 12 hours and 18 shipments
Dock to stock = (# hours for received product to be put away) / (# shipments)
Dock to stock = (12 hours / 18 shipments)
Dock to stock = 0.67 hours per shipmentThe equation shows that the dock-to-stock cycle time for this company is 0.67 hours per shipment.
-
Units Processed per Square Foot: Units processed per square foot, also known as productivity in transferred volume, are distribution metrics that compare the number of units or goods processed to usable warehouse space.
Units Processed per Square Foot Example: 60,000 units and 16,400 square feet of usable area.
Units processed per square foot = (# units processed) / (useable space)
Units processed per square foot = 60,000 units / 16,400 square feet
Units processed per square foot = 3.7 units/ft2In this situation, there are 3.7 units/ft2, taking up a fair amount of usable warehouse space.
-
Space Use in Warehouse: Space use in warehouse, also known as space utilization, is the percent of bins used. This metric ensures optimal use of warehouse space. Calculate this metric by comparing the amount of warehouse space used by what is available.
Space Use in Warehouse Example: 3,300 feet square used in a 16,500-foot square warehouse
Space used in warehouse = (warehouse space with product) / (total warehouse space) × 100
Space used in warehouse = 3,300 ft2 / 16,500 ft2 × 100
Space used in warehouse = 20%In this example, 20% of the warehouse space is filled with product, which is average for warehouses.
Formulas for Logistics Performance Metrics
-
Cost per Pound: Cost per pound is the cost of a shipment compared to its weight in pounds. Use this measure to compare carriers, weekly invoices and individual shipments.
Cost per Pound Example: $836.24 for a shipment of 2,200 lbs.
Cost per pound = (Cost of shipment) / (Weight of shipment)
Cost per pound = $836.24 / 2,200
Cost per pound = $0.38In this situation, the cost per pound is $0.38. This result is typical; the most frequent ranges are $0.22–$0.42. A per-pound fee anywhere between $0.06 and $0.75 is not unusual.
-
Cost per Mile: Cost per mile calculates the profit distribution for a load. Marketing also uses this metric for campaigns. However, in distribution, the measurement is the total monthly expenses or total load cost compared to the number of miles driven. The prices are fixed and variable.
Cost per Mile Example: $2,540 variable costs, $2,312 fixed costs and 3,600 monthly miles
Cost per mile = (Total fixed and variable costs) / (Monthly miles)
Cost per mile = ($2,540 + $2,312) / (3,600 miles)
Cost per mile = $1.34 per mileIn this example, if the mileage stays at 3,600 miles per month, spending $1.34 per mile will meet expenses.
-
Number of Shipments: The number of shipments is a straightforward metric representing the monthly count of how many shipments a company sends. Companies can break this down by region, country or product type. The totals will show the seasonal fluctuations and help companies prepare and allocate resources over the year.
Number of Shipments Example: 200 shipments added up for the month.
Monthly shipment, by region:
Eastern region: 120
Western region: 40
Southern region: 40Monthly shipment, by product type:
Information widgets: 12,040
Control widgets: 2,440
Hybrid widgets: 1,832
Collection widgets: 10,030In this scenario, we broke down the loads by region and product. For example, 120 shipments of four different products, totaling 26,342 items, went to the eastern region last month.
KPI Do's and Don'ts
Choose KPIs based on goals and objectives. Start with what executive leadership is looking for and map out priorities from the broad to the granular level.
Apply metrics to each priority. Then, go back and reprioritize what to measure and remove extraneous measures. Ten to 20 KPIs are an ideal number for an entire company.
More do's and don'ts for choosing KPIs and measuring them include:
KPI Do's
- Prioritize processes and operations.
- Make your KPIs relevant.
- Choose simple, attainable KPIs. Simple measures lead to targeted fixes.
- Consider the performance elements of your chosen metrics.
- Focus on the activities that help staff perform better.
KPI Don'ts
- Do not make up new standards. Learn about your industry KPIs and focus on them first.
- Do not develop measures without getting buy-in from staff.
- Do not make your KPIs intangible. Regularly review them and make adjustments.
- Do not make your KPIs static. Raise the benchmarks once you meet or exceed them.
- Do not shoot for merely meeting minimums for all KPIs. Instead, strive to reach the minimum acceptable performance levels.
Logistics Metrics Scorecards
A logistics metrics scorecard is a report that shows metrics by category. Then, the scorecard rates each prospective company's numbers against a benchmark. Each company should fix any failures on the scorecard before the next review.
Examples of Logistics Scorecards
Scorecards are a proxy for performance. Logistics scorecards that compare prospective companies are good examples to follow. They compare organizations to each other and industry standards.
Choose metrics and displays that target what your company needs in partners. For example, a scorecard could include receiving, storage, shipping, putaway, and pick and pack. Each category is a scorecard itself, and set the industry benchmark as the standard. Then show how close the company comes to that standard with a percentage. For these categories, the specific KPIs are:
Receiving Scorecard
- Cost of Receiving
- Productivity of Receiving Labor
- Efficiency of Receiving
- Receiving Accuracy
- Dock Utilization
- Receiving Cycle Time
Shipping Scorecard
- Shipping cost per line
- Dock Utilization
- Shipping Accuracy
- Back Order Rate
- Rate Orders Received Damage-Free
- Average Time to Customer
Pick & Pack Scorecard
- Cost of Pick & Pack
- Picking Productivity
- Packing Material Use Rate
- Equipment Dock Utilization
- Picking Accuracy Rate
- Returns Rate
- Returns Cost
- Pick & Pack Cycle Time
Putaway Scorecard
- Cost per Line
- Staff Productivity
- Space Utilization
- Putaway Accuracy
- Putaway Cycle Time
Other scorecard examples focus on areas like safety and customer service.
Safety Scorecard
- Costs of Safety Prevention
- Cost of Poor Safety Measures
- Lost Time to Injuries
- Number of Safety Trainings per Period
Customer Service Scorecard
- First Response Time
- Customer Retention Rate
- Customer Satisfaction Score
- First Contact Resolution
- Average Resolution Time
- Cost per Conversation
- Net Promoter Score (NPS)
Logistics Dashboards
A logistics dashboard offers a comprehensive view of a company's metrics. For efficiency, organize the dashboard by topic, division or workgroup. Another way to manage dashboards is by whether they are operational, strategic or analytical.
Logistics Dashboard Examples
A well-organized and cohesive logistics dashboard uses visuals that are clean and enable your staff to find what they need quickly. They should also be able to see progress and goals for various metrics.
Dashboards often have more than just KPIs on them. They also feature links to navigate to outstanding worklists, reminders and line lists. They should have everything the staff needs to help conduct their work.
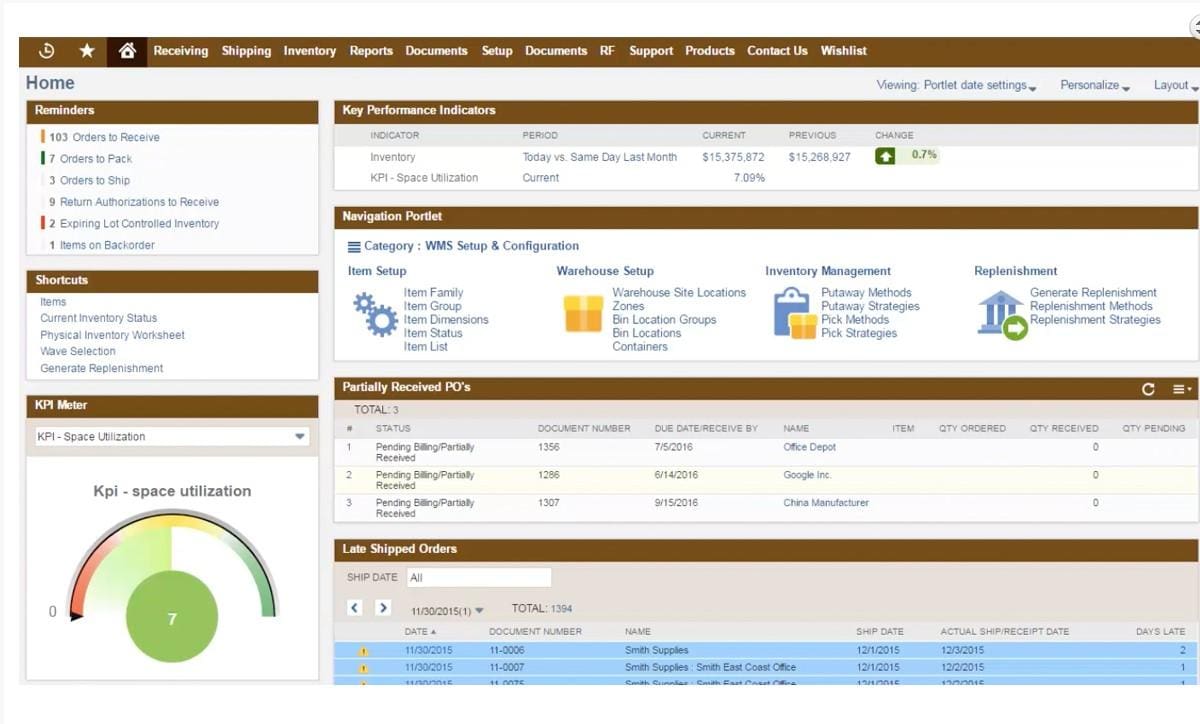
For example, the following warehouse management dashboard organizes the KPIs, tracks progress and includes the information that leads to those KPIs. It’s well-organized and visually cohesive.
Warehouse Management Dashboard
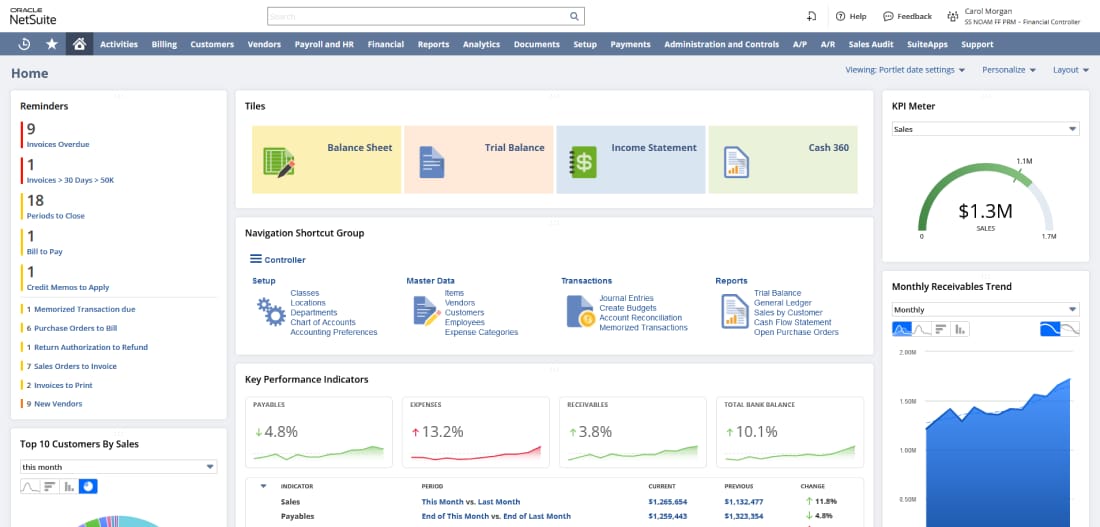
The business intelligence analytical dashboard below is another good example. The design presents the most critical information front and center, in bold colors. The metrics are all related.
Analytical Dashboard
The following strategic finance dashboard also has cohesive metrics, colors and themes. Users can find detailed information as well as high-level indicators that executives can pull out quickly.
Strategic Finance Dashboard
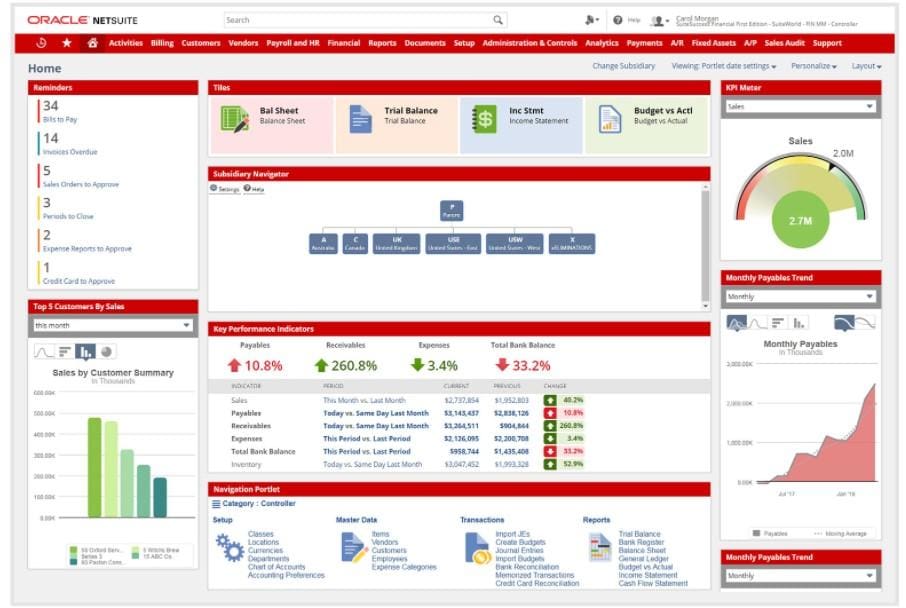
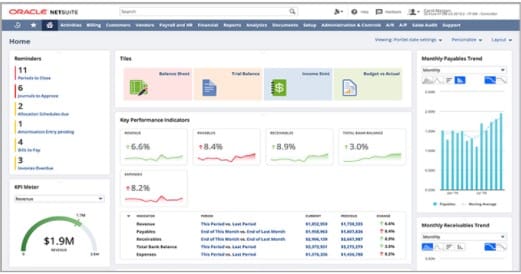
This dashboard shows its KPIs and makes a point to highlight progress over the period. A simple view places the most important links, reminders and metrics front and center.
Overall Company Metrics Dashboard
8 Simple Steps for Developing Your Own Logistics Scorecard or Dashboard
The steps for creating scorecards and dashboards start with a deep understanding of your company's priorities. Dashboards record what a business is doing, while scorecards illustrate how well a business is doing. Follow these steps to create your own:
- Understand Company Priorities
These are the objectives and goals around each business function, department or team. It’s a good idea to solicit the help of a subject-matter expert who has a deep understanding of that department’s work. - Identify the Necessary Measures
All short-term goals should have appropriate, targeted metrics. You may need to rework your initial choices. They may end up being too complicated or not within reach. Focus on the outcomes. - Organize the Metrics
Stick to a theme. For example, if the business unit is outward-facing, provide insight into customer service improvements. If this is a goal, organize customer service KPIs together into a scorecard and any dashboards. - Make the Periods and Increments Consistent
You can look at different periods, such as monthly or yearly. Whichever you choose, make the period consistent across all metrics. Also, ensure the increments in the measurements are constant. When people look at metrics, they want apples-to-apples comparisons. - Identify the Data Source and Benchmark Source
Ensure you point out staff responsible for each metric and set clear schedules for updates. On scorecards, show where the benchmarks originate. - Consider Cumulative Metrics
If you are tracking KPIs monthly, consider including graphs or roll-up columns for year-to-date to show staff and customers your progress. - Show the Visuals
Visuals show the big picture. The best visuals give you the highlights at a glance—staff should not have to work hard to understand their data. - Develop the Dashboards from the Scorecards
There is no reason to reinvent the wheel. If your scorecards are electronic, link to or use pieces from them to develop your dashboards. Add in additional requirements such as reminders and links when necessary. Use steps 1 to 7 above to build powerful dashboards.
Measure, Visualize, and Track Logistics KPIs with NetSuite Software
Companies can measure, track and visualize logistics KPIs with software. The right systems also give you the flexibility to develop and update your KPIs. Develop your metrics into cohesive and helpful scorecards and dashboards so you can pinpoint areas for improvement at-a-glance.
NetSuite’s cloud ERP software provides all the necessary tools to capture, analyze and display logistics metrics throughout the organization with role-based and industry-specific dashboards and prepopulated KPIs. NetSuite offers software for transportation and logistics companies as well as outbound logistics functionality that provides simplified pick, pack and ship, cross-subsidiary fulfillment and carrier integration. Its inbound logistics functionality allows businesses to track KPIs easily with purchase order receiving workflows, automatic quality assurance processes and container tracking through inbound shipping management features.
To stay competitive today, businesses need to measure various logistics-related KPIs so they know what needs to be improved. This ability to identify and resolve specific issues that are leading to unecessary expenses or impairing the customer experience will put companies in a position to succeed, regardless of the specific market they serve.


