Data overload can overwhelm the savviest CFOs. The fix lies in tracking the right key performance indicators (KPIs) to be sure that their organizations’ profitability, liquidity, efficiency, and growth initiatives are progressing in the right direction. This article explores 40 critical KPIs for CFO dashboards, why they matter, and how to calculate each one.
What Are CFO KPIs?
CFO KPIs are metrics that quantify specific aspects of financial performance, including profitability, liquidity, and efficiency, over a period of time. KPIs are used to analyze the impact of short- and long-term strategies, track progress toward goals, identify opportunities and risks, and communicate performance to stakeholders.
KPIs also play a crucial role in guiding financial decisions, helping CFOs and leadership teams optimize resource allocation, improve operational efficiency, and drive overall business performance.
What Is a CFO Dashboard?
A CFO dashboard is a visual tool that integrates companywide data in a single interface that can be accessed from office desktops and mobile devices. It displays real-time information pulled from accounting systems, ERPs, and other financial software in the form of easy-to-read charts, graphs, and tables customized for different stakeholders.
Dashboards can be configured so CFOs can switch between static reports, trend analyses, and detailed drill-downs in order to trace issues to root causes. If revenue suddenly drops, for example, they can quickly compare pricing, volume, and customer data to figure out what happened.
Key Takeaways
- The best KPIs align with the business’s goals, including standard efficiency targets as well as emerging priorities.
- CFOs should establish a mix of leading and lagging KPIs that track profitability, liquidity, efficiency, and growth.
- These KPIs include net profit margin, the quick ratio, the cash conversion cycle, and revenue growth rate.
- Dashboards integrate real-time financial data from multiple systems, alerting CFOs when numbers dip below a predetermined threshold.
CFO KPIs Explained
KPIs turn raw accounting data into usable insights. For example, if days sales outstanding (DSO) has steadily risen from 45 to 60 days, CFOs would likely investigate accounts receivable processes—collections, credit policies, and customer payment behaviors—before the lag constrains cash flow. Similarly, by measuring profit margins at different levels—gross, operating, and net—executives can pinpoint high-expense areas or the most promising opportunities to boost profitability.
Both of these examples illustrate how KPIs act as early signals of changes that warrant attention. DSO functions as a leading indicator of possible liquidity issues, while margins reflect lagging performance outcomes. CFOs rely on both types of KPIs to understand where the business stands today and where it may be headed. Other leading indicators, such as rising customer acquisition costs or a slowing sales pipeline, can also reveal emerging risks, giving CFOs time to adjust spending, accelerate collections, renegotiate vendor terms, or pursue external financing before their financial position deteriorates.
The Top 40 CFO KPIs
CFOs often track dozens of KPIs that align with strategic priorities. The following 40 KPIs (and standard versions of formulas) illustrate this range, from broad profitability metrics, such as revenue growth and margin analysis, to granular measures of capital efficiency, strategic positioning, and sustainability. Converting results to percentages enhances interpretability and comparability.
1. Revenue Growth Rate
Revenue growth rate measures the percentage change in sales over a given period, serving as the primary indicator of business momentum. CFOs typically track this metric monthly, quarterly, and annually to spot sales patterns and monitor the impact of companywide initiatives and investments.
Revenue growth rate = (Current period revenue – Previous period revenue) / Previous period revenue
2. Gross Profit Margin
Gross profit margin calculates the portion of revenue left over after the business pays its direct production costs. It shows overall production efficiency, helping CFOs identify ways to improve margins and evaluate pricing strategies and supplier expenses.
Gross profit margin = (Revenue – Cost of sales) / Revenue
3. Net Profit Margin
Net profit margin is the portion of revenue left after the business pays all of its expenses, including taxes and interest payments. Based on net income, the net profit margin is a standard benchmark for profitability, efficiency, and competitive standing.
Net profit margin = Net income / Revenue
4. EBITDA Margin
The earnings before interest, taxes, depreciation, and amortization (EBITDA) margin focuses solely on operating profitability, determined by subtracting the impact of financing, taxes, and accounting methods. CFOs use EBITDA as a comparative baseline for performance across companies with different capital structures or business units within the same organization.
EBITDA margin = EBITDA / Revenue
5. Operating Profit Margin
Operating profit margin (aka operating margin and return on sales) measures profitability from core business operations—cost of goods sold (COGS), administrative expenses, and salaries. It excludes interest, financing costs, and taxes. CFOs use operating profits to evaluate how well the company is controlling its expenses while generating revenue from primary business activities.
Operating profit margin = Operating income / Revenue
6. Return on Investment (ROI)
ROI measures the profitability of an investment relative to its cost. CFOs use ROI to prioritize capital allocations and investments, based on project viability and opportunity costs.
ROI = (Current value of investment – Cost of investment) / Cost of investment
7. Compound Annual Growth Rate (CAGR)
CAGR calculates the average growth rate of a KPI over multiple years, smoothing out—but not ignoring—any year-to-year volatility or outlier periods. CFOs use CAGR to understand long-term performance trends, set realistic targets, and demonstrate consistent growth to investors.
CAGR = (Ending value / Beginning value)(1 / Number of Years) – 1
8. Return on Equity (ROE)
ROE measures the return on a business’s net assets (aka shareholder’s or owner’s equity). CFOs use this metric to show investors how well the company is using its capital to create value.
ROE = Net income / Shareholder equity
9. Earnings per Share (EPS)
EPS calculates how much profit is allocated to each outstanding share of stock. This KPI directly influences stock valuation and helps CFOs quantify profitability and performance for investors and analysts. CFOs typically calculate EPS in two ways: basic, which considers currently outstanding shares only; and diluted, which includes outstanding shares plus potential shares from convertible securities.
EPS = (Net income – Preferred dividends) / Average outstanding shares
10. Return on Assets (ROA)
ROA measures how much profit a company generates relative to its assets. CFOs use this KPI to assess how well their organization is using its resources, as well as to detect underperforming assets in need of adjustment, reallocation, decommissioning, or selling.
ROA = Net income / Total assets
11. Contribution Margin
Contribution margin measures the profitability of individual goods or services, product lines, departments, or business units after deducting variable costs from revenue. CFOs use contribution margins to inform product mix and pricing strategies and to determine break-even points for new endeavors. Finance teams may also calculate this metric as a ratio by dividing the margin by revenue.
Contribution margin = Revenue – Variable costs
12. Working Capital
Working capital—the difference between current assets and current liabilities—is a common metric for quantifying short-term financial health. CFOs monitor working capital over time to make sure they have sufficient cash on hand to pay immediate obligations. This KPI also helps leaders balance day-to-day needs with long-term investment decisions.
Working capital = Current assets – Current liabilities
13. Operating Cash Flow
Operating cash flow is the total amount of cash generated from core business operations, excluding financing and investing activities. This KPI indicates a company’s ability to fund operations and growth investments without the need for additional financing.
Operating cash flow = Net income + Non-cash expenses + Changes in working capital
14. Free Cash Flow (FCF)
FCF represents the amount of cash available after operating expenses and capital investments are paid—funds that companies can then use to reduce debts, pay dividends, or invest in new initiatives. External parties also consider FCF when valuing companies for investment purposes.
Free cash flow = Operating cash flow – Capital expenditures
15. Current Ratio
The current ratio assesses a company’s ability to meet current obligations—those due within a year—by comparing current assets to current liabilities. CFOs use this ratio alongside other short-term liquidity measures, like the quick ratio (next), to identify cash flow constraints before bills come due.
Current ratio = Current assets / Current liabilities
16. Quick Ratio
The quick ratio is a more stringent version of the current ratio, focusing exclusively on a business’s most liquid assets. CFOs use the quick ratio to evaluate how effectively their companies can meet short-term obligations without having to sell inventory or other, less liquid assets. This KPI is especially valuable during market disruptions or volatile sales periods, when immediate liquidity becomes critical.
Quick ratio = (Cash + Marketable securities + Accounts receivable) / Current liabilities
17. Burn Rate
Burn rate measures how quickly a business is spending its cash. Frequently calculated on a monthly basis, some businesses—such as rapidly expanding companies and startups—may benefit from weekly assessments. The two primary types of burn rate are gross and net.
Gross burn rate = Cash / Monthly operating expenses
Net burn rate = Cash / Monthly operating losses
18. Burn Multiple
Burn multiple compares cash spent to revenue generated. CFOs use this KPI to determine the efficiency of their investments and how best to allocate resources.
Burn multiple = Net burn / Net new annual recurring revenue
19. Cash Runway
Cash runway calculates how long a company can maintain current spend rates before depleting cash reserves—an especially important metric for startups. Measured in months, this KPI helps finance staff determine whether they need to raise capital, adjust spending, or reassess sustainability.
Cash runway = Cash balance / Monthly net burn rate
20. Net Working Capital as a Percentage of Revenue
This ratio assesses a business’s operational efficiency and short-term health relative to its size. CFOs track net working capital as a percentage of revenue to compare their company’s performance against industry standards and to identify opportunities to free up cash through better working capital management.
Net working capital as a percentage of revenue = (Working capital / Annual revenue) × 100
21. Accounts Payable Turnover
Accounts payable turnover calculates how quickly a company pays its bills, on average, over a given period. CFOs use this ratio to manage cash flow, taking care not to delay payments so long that vendor relationships become strained or it causes the company to miss out on early payment discounts.
Accounts payable turnover = Total credit purchases / Average accounts payable
22. Accounts Receivable Turnover
Accounts receivable turnover measures how quickly a company collects payments from customers over an accounting period. By quantifying how quickly sales convert to cash, this ratio helps CFOs assess the effectiveness of the business’s credit and collection policies.
Accounts receivable turnover = Net credit sales / Average accounts receivable
23. Days Sales Outstanding (DSO)
DSO is the average number of days that elapse from the time a company makes a sale and collects payment. DSO trends help financial teams assess credit risk for individual customers, manage cash flow, and spot collection issues before cash dries up.
DSO = (Average accounts receivable / Total credit sales) × Number of days
24. Days Payable Outstanding (DPO)
DPO calculates the average number of days it takes a company to pay its suppliers and vendors over a given period. CFOs monitor DPO over time to optimize their cash position—again, balancing decisions against their impact on supplier relationships.
DPO = (Average accounts payable / Cost of goods sold) × Number of days
25. Cash Conversion Cycle (CCC)
The cash conversion cycle measures the time it takes a company to sell off inventory, collect payments from customers, and pay its bills. Shorter cycles indicate well-managed working capital and quicker inventory turnover and collections.
CCC = Days inventory outstanding + Days sales outstanding – Days payable outstanding
26. Days to Close/Financial Close Cycle Time
Days to close measures the time it takes teams to complete the company’s financial statements after a period ends, often viewed as a monthly or yearly average. CFOs use this KPI to measure the efficiency of the reporting process and analyze the impact of improvements, such as those achieved through automation.
Days to close = Final financial statement date – Period end date
27. Debt-to-Equity Ratio
The debt-to-equity ratio compares a company’s total debt to shareholders’ equity, revealing how much it is financed by debt versus by owner investments. An indication of financial leverage or potential risk, this KPI informs capital structure decisions and signals financial stability to lenders, creditors, investors, and rating agencies.
Debt-to-equity ratio = Total debt / Total shareholder equity
28. Capital Structure and Leverage
Capital structure analysis examines the mix of debt and equity financing through multiple leverage ratios, such as debt-to-equity (above) and debt-to-capital. CFOs use these combined metrics to fine-tune the company’s financial leverage, strategically positioning the organization to pursue growth opportunities, especially while weathering market downturns.
Debt-to-capital ratio = Total debt / (Total debt + Total shareholder equity)
29. Interest Coverage Ratio
The interest coverage ratio measures a company’s ability to pay interest expenses on its debt, based on using earnings before interest and taxes CFOs use it to assess the business’s debt capacity and refinancing opportunities, and lenders use it to assess credit risk.
Interest coverage ratio = EBIT / Interest expense
30. Budget Variance
Budget variance compares actual financial results to prior revenue and expense targets. When performed regularly, variance analysis can help finance leaders identify root causes of differences and improve future plans. Budget variance is commonly expressed either as a percentage or as an absolute value.
Budget variance = (Actual – Budget) / Budget
31. Expense Overrun Ratio
The expense overrun ratio measures how much actual expenses exceed the budget; it can be calculated for specific projects, departments, or the entire organization. CFOs use this KPI to identify cost control issues and implement corrective actions before overruns impact profitability.
Expense overrun ratio = (Actual expenses – Budgeted expenses) / Budgeted expenses
32. SG&A Expense Ratio
The SG&A expense ratio—aka the percent of sales method—calculates the share of revenue that goes toward a business’s selling, general, and administrative costs. Financial teams use the ratio to guide appropriate overhead budgets, assess the business’s price and cost structures, and find areas to reduce costs.
SG&A expense ratio = SG&A expenses / Revenue
33. Operating Efficiency Ratio (OER)
OER measures the portion of revenue that goes toward operating costs. It is a key indicator of operational efficiency, used by CFOs to compare performance among facilities, departments, or competitors and to identify places where investments in cost-cutting efforts, like automation, could improve margins.
Operating expense ratio = Operating expenses / Revenue
34. Revenue Variance Ratio
The revenue variance ratio calculates the difference between budgeted (or forecasted) revenue and actual revenue to assess accuracy. CFOs often break it down by price, volume, and product mix to identify revenue drivers and improve forecasting.
Revenue variance ratio = (Actual revenue – Budgeted revenue) / Budgeted revenue
35. Customer Acquisition Cost (CAC)
CAC measures the average sales and marketing spend required to acquire a new customer. CFOs compare CAC to other customer metrics, such as customer lifetime value (next), to gauge the ROI of its acquisition efforts and assess the long-term profitability of different customer segments or marketing channels.
CAC = Total sales and marketing expenses / Number of new customers acquired
36. Customer Lifetime Value (CLV)
CLV calculates the total revenue each customer generates for the business, helping CFOs prioritize different segments and informing retention strategies. Executives use several versions of the following basic formula; for example, some factor in CAC, profit margins, or retention rates.
Basic CLV = Average transaction size × Number of transactions × Retention period
37. Revenue per Employee
Revenue per employee quantifies how much income, on average, each worker generates. CFOs assess this productivity KPI over time to analyze both productivity and the impact of workforce expansion efforts and process improvements.
Revenue per employee = Total revenue / Number of employees
38. Finance Process Automation Progress
Finance process automation progress tracks the number of financial transactions and processes completed by automated systems. CFOs use this KPI to monitor digital workflow transformations and identify additional automation opportunities. It is especially useful as companies deploy AI throughout their operation.
Finance process automation = Automated transactions / Total transactions
39. Weighted Average Carbon Intensity (WACI) by Revenue
WACI measures a company’s carbon emissions relative to its revenue, indicating the carbon intensity of its operations. Used for environmental, social, and governance (ESG) purposes, this KPI helps companies align their sustainability efforts with regulatory requirements and stakeholder expectations. Some CFOs also track WACI by other metrics, such as profits or total assets.
WACI = Carbon emissions / Revenue
40. Physical Carbon Intensity Ratios (by Industry)
The physical carbon intensity ratio gauges emissions per unit of output, as defined by individual industries. This production-based KPI helps CFOs assess environmental impact, set meaningful reduction targets, and track progress toward sustainability commitments.
Carbon intensity = Total carbon emissions / Units of production
How to Choose Which KPIs to Include on Your CFO Dashboard
Whether it’s to improve cash flow, increase margins, accelerate growth, or a host of other goals, CFOs choose KPIs that will best monitor progress toward their company’s strategic priorities and planned development. For instance, a startup might prioritize burn rate and cash runway when it first enters a market, whereas an established manufacturing company that has invested heavily in lean processes would be more apt to focus on inventory turnover and gross margins. Selection should be industry-specific and balanced across KPI categories—profitability metrics for long-term health, liquidity KPIs for short-term stability, efficiency ratios for performance, and trend analysis for planning. Furthermore, choosing a mix of lagging indicators for historical analysis and leading indicators that predict performance can help create a comprehensive view of the company’s financial health and potential.
Still, moderation is key. Avoid overwhelming teams with too many data points that can dilute focus from critical performance drivers. Regularly review a core set of KPIs—weekly, monthly, or quarterly—keeping a handful of additional metrics available for deeper, targeted analysis when needed. Adjust KPIs quarterly or when making major strategic shifts; what matters most during rapid business expansion isn’t necessarily relevant during periods of market consolidation or economic uncertainty.
Example CFO Dashboard
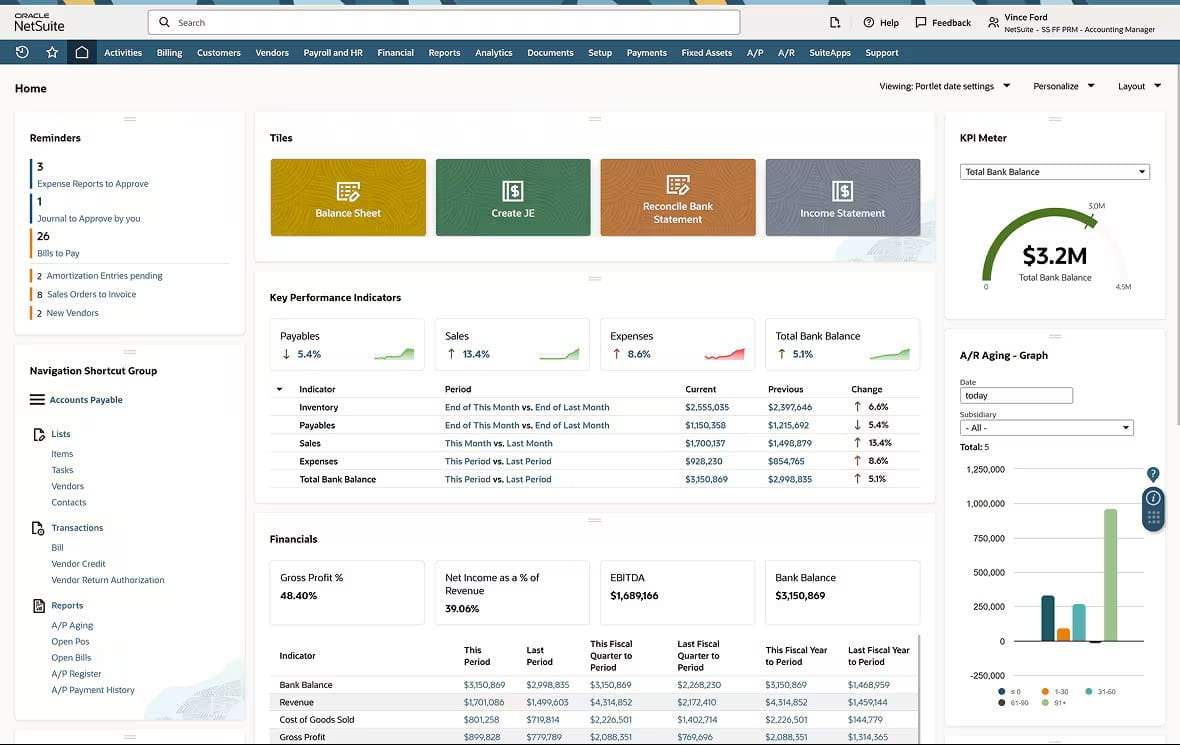
A typical CFO dashboard visually displays KPIs in the form of charts, tables, and other representations according to their importance and frequency of review. Standard layouts group related KPIs—revenue and profitability in one section, cash flow and liquidity in another, operational efficiency ratios in a third, for example—creating a logical information flow that supports quick decision-making.
For example, a CFO at a growing manufacturing company might customize the dashboard to feature payables, sales, expenses, and bank balances at the top to monitor short-term health, then place inventory and month-over-month revenue trends in the middle for bigger-picture efficiency and growth patterns. Additional areas may include more granular metrics, such as COGS, gross profits, and additional payable and receivable trends, to create a more complete view of financial performance. Dashboards are typically optimized for mobile devices and automatically alert users when KPIs fall out of predetermined ranges.
Sample Financial Dashboard
How to Use KPIs Most Effectively
Effective use of KPIs hinges on two main factors: regular reviews and established thresholds for triggering further investigation and corrective actions. For example, a DSO exceeding 60 days might set off a collections review, or a 2X burn multiple could initiate a review of expense approvals. Automated alerts support proactive management before issues escalate, especially when each KPI is linked to a responsible decision-maker who can implement changes when performance deviates from targets.
CFOs should analyze KPIs over rolling periods to establish trends, adjusting strategies as real results come in. They should also hold regular KPI review meetings with diverse stakeholders who can analyze exceptions and variances to better understand their root causes and develop realistic action plans. These approaches help CFOs replace passive reporting tools with active processes that drive measurable improvements.
Track Financial Health and Growth With NetSuite
Managing KPIs across multiple, siloed systems can lead to reporting delays, errors, and misinformed insights that compound companywide. NetSuite’s CFO solution integrates financial data from various business systems into customizable dashboards that update as transactions occur. The system automatically calculates metrics, such as CCC and CLV, while role-based dashboards deliver targeted KPIs to every stakeholder—from executive summaries to detailed operational metrics. Automated alerts flag when critical metrics, like DSO or quick ratios, dip below accepted ranges, and built-in drill-down capabilities help CFOs investigate the root causes of variances. NetSuite’s scalable cloud platform is optimized for mobile devices, giving staff access to detailed data and automated reporting that unlocks faster, more informed decision-making no matter where they are.
CFOs use KPIs to monitor their companies’ financial health, efficiency, and growth and to set realistic expectations and growth targets. To get the most out of their KPIs, finance teams must first understand their companies’ objectives, curate a list of the most relevant indicators, and establish clear review processes that factor for changing conditions and priorities. Indeed, as market conditions evolve, CFOs will want to adjust their KPIs to make sure they’re tracking the information they need to stay competitive and capitalize on growth opportunities.
Award-winning
expense
management
software
Free
Product
Tour(opens in a new tab)
CFO KPIs FAQs
What is a CFO-level dashboard?
A CFO-level dashboard is a digital interface that finance leaders customize to display financial and operational metrics. Dashboards typically feature a handful of key performance indicators arranged by their strategic importance, as well as real-time updates and drill-down capabilities for analysis.
How do you measure CFO performance?
CFO performance is measured through a combination of financial metrics, such as net profit margins and working capital efficiency, as well as strategic outcomes, such as successful raising of capital and accurate forecasting. Some organizations also track such metrics as burn rates and capital structure ratios to evaluate CFOs.
Which reports does a CFO need?
CFOs typically need three reports: financial statements (income statement, balance sheet, cash flow), management reports that analyze variances and KPIs, and forward-looking reports, such as rolling forecasts and what-if scenarios. Financial management systems automate this reporting and present at-a-glance results in dashboards for quick analysis and decision-making.
What are the core responsibilities of a CFO?
CFOs oversee financial planning and analysis, cash management, reporting, compliance, and long-term financial initiatives. Many CFOs also lead financial software deployment efforts, manage investors, manage risk, and advise the CEO and board on major decisions.