
Financial analytics are tools and processes that turn financial and other data into forward-looking insights. They identify patterns and trends, highlight inefficiencies and explore operational relationships in a way that historical financial statements can’t. Some financial analytics are predictive, which helps business leaders steer their companies more successfully into the future, while others improve the quality of day-to-day decision-making. In most cases, deployment of financial analytics falls to organizations’ chief financial officers (CFOs) and their corporate finance teams. This article explains what financial analytics are, their benefits and challenges, and 12 key analytics to track.
What Is Financial Analytics?
Financial analytics is the examination of a business’s financial and operational data in the context of external information, with the goal to help business leaders better understand their company’s results and make decisions to shape its future. Financial analytics can use the accounting information found in a company’s general ledger and historical financial statements. However, more often than not, financial analytics extends several steps further and includes other available data that can help answer a larger variety of business questions. For example, financial analytics can help uncover relationships between social media product reviews and sales returns or show which sales channels have the highest profit margins by geographic location.
Most businesses have access to all kinds of qualitative and quantitative data from various sources; financial analytics helps synthesize this volume of data into meaningful insights. These insights, such as trends, patterns and projections, help business leaders manage in a data-driven way.
Key Takeaways
- Financial analytics use various types of data from multiple sources to uncover insights that support data-driven decision-making.
- Predictive and advanced analytics inform all aspects of financial management, including cash flow, profitability, forecasting and risk management.
- Structured and unstructured data need to be curated, secured and standardized to ensure the integrity of the resulting analytics.
- Successfully employing financial analytics requires collaboration between the finance and IT teams.
- Technology is pivotal for financial analytics.
Financial Analytics Explained
Financial analytics come in many forms, from simple ratio analyses to sophisticated advanced analytics supported by artificial intelligence (AI). Its most important characteristic is that it is tailored to meet the needs of a given business’s leaders. An organization’s finance team is customarily the one that adopts financial analytics, usually when the company feels the need to move beyond backward-looking analysis and begin to do prospective analysis to support and shape decisions for the future.
Financial analytics uses structured and unstructured data to provide a deeper understanding of business situations, such as market trends, operational efficiencies, customer behavior, risks and opportunities. Structured data, typically quantitative financial information, usually comes from an organization’s internal systems, including accounting, human resources, customer relationship management and enterprise resource planning (ERP) systems. Additional structured data may also be provided by external sources, such as market data outlets, regulatory filings or industry-specific associations or research houses.
Unstructured data, on the other hand, is typically text-heavy, though it can come in many forms and from many places. Examples include customer reviews, product images, survey results, social media posts, emails and videos. Unstructured data has always been extremely valuable, but its usefulness was limited until new technologies began scraping and extracting this data to identify patterns and convert it to searchable text. Applying powerful analytic tools, such as machine learning and generative AI, or even some rudimentary ratios in the form of key performance indicators (KPIs) can unlock powerful correlations between structured and unstructured data.
Two other categories of financial analytics that are important to understand are predictive analytics and advanced analytics.
- Predictive analytics, as its name suggests, evaluates historical data and trends in order to make predictions or forecasts about the future. It is a subset of advanced analytics. For financial analytics, predictive might include extrapolating market size, customer demand or cash flow requirements. Predictive financial analytics can help a business better prepare for the future by exploiting potential opportunities and mitigating anticipated risks.
- Advanced analytics uses complex tools, including AI capabilities such as machine learning and natural language processing, plus sophisticated data science methods to uncover insights from massive volumes of data. Examples of advanced financial analytics include examining public sentiment to better understand customer demand, running hundreds or thousands of scenarios to optimize an investment portfolio (known as a Monte Carlo simulation) and predicting factory machinery maintenance needs based on usage and expected production output. The unique value of advanced financial analytics is its use of complex algorithms to extract timely insights from massive data sets, which is beyond the ability of human analysts.
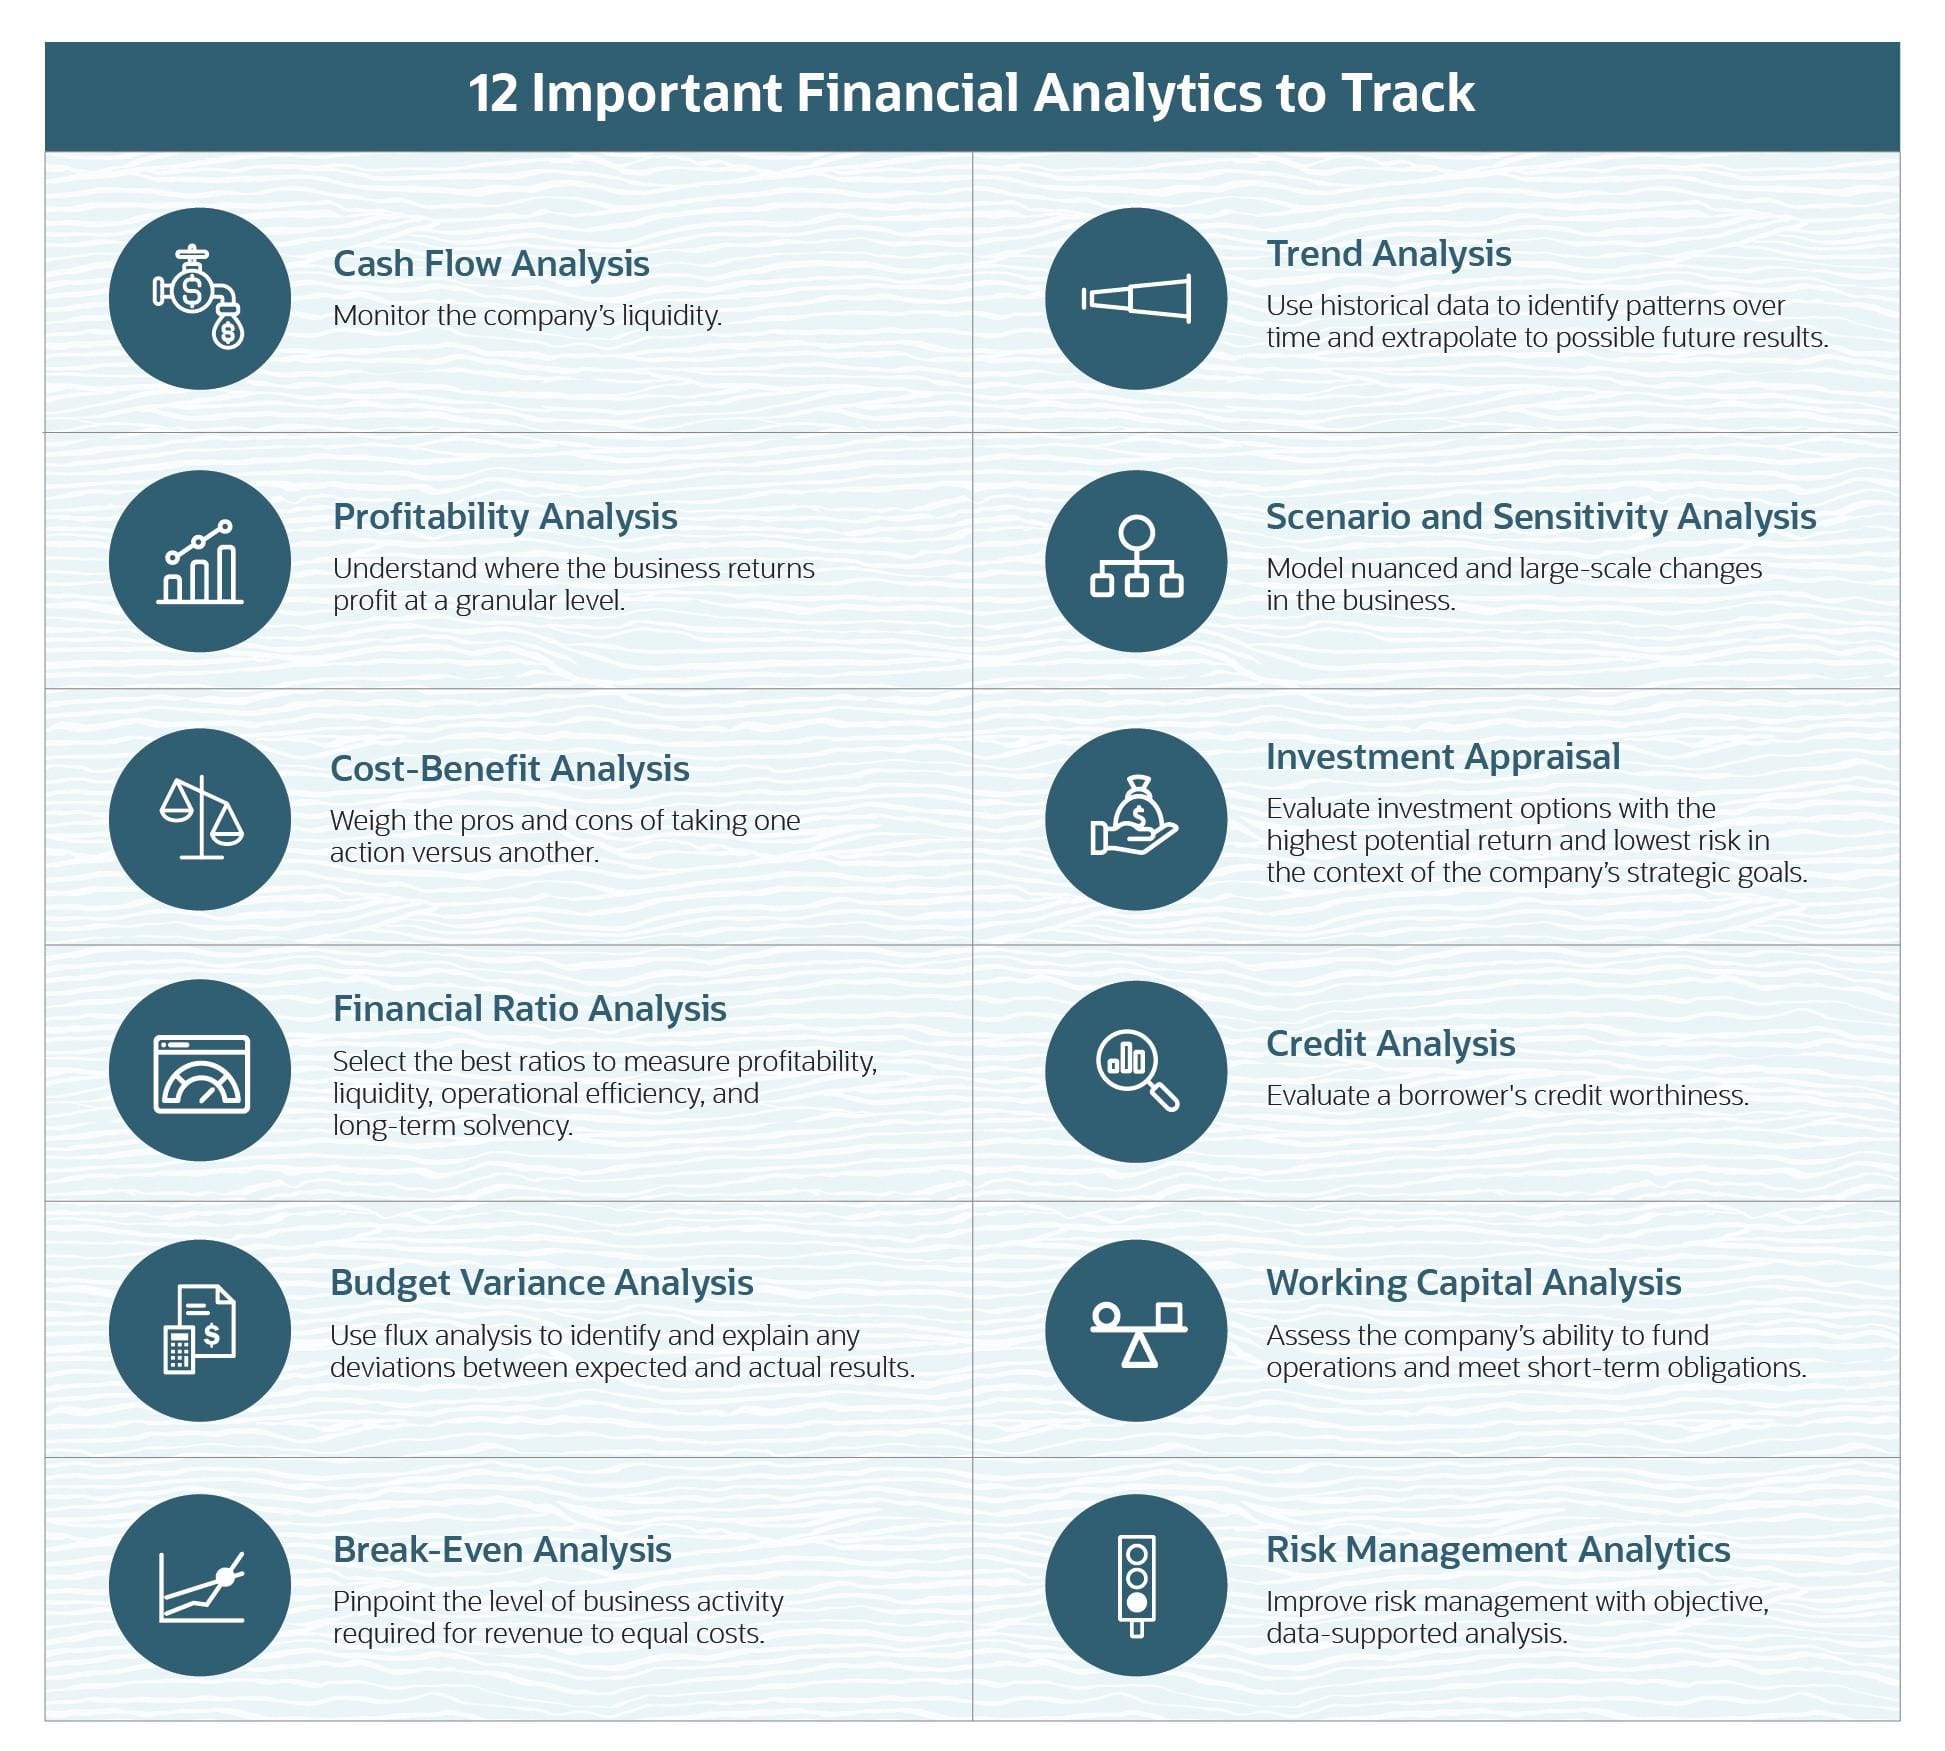
12 Important Financial Analytics to Track
Improving financial metrics and insights is a top-five priority for CFOs in 2024, according to a recent survey from Gartner. While selecting the specific analytic that best fits a particular business question depends on the question and the situation, most businesses should regularly monitor the following 12 analytics as part of a good financial management practice.
1. Cash Flow Analysis
Tracking cash coming into and out of a business is important to make sure that short-term commitments can be met, such as paying employees and suppliers. Cash flow analytics monitor a company’s liquidity and can include KPIs such as the current ratio and quick ratio, which are different ways to compare the values of a company’s easily converted assets against current liabilities.
2. Profitability Analysis
Analyzing profitability provides deeper insights into how a company is making a return on its investment in operations. Profitability KPIs take many forms and can focus on different levels of the business, such as by division, product, customer, department or companywide.
3. Cost-Benefit Analysis
Because resources like time and capital are limited for most businesses, a cost-benefit analysis can be helpful when making decisions about how to allocate them. Cost-benefit analyses use a data-driven approach to quantify the costs of a course of action and compare that to the potential benefits of the action. Then the pros and cons are weighed against the cost-benefit of alternative courses of action. For example, a company that is considering hiring a new salesperson would aggregate the explicit personnel costs, such as salary, commissions, benefits, travel and entertainment, and overhead, and compare them to the potential incremental revenue and/or incremental profit on that revenue that the salesperson might close in a given year. When doing cost-benefit analyses, it’s important to include implicit costs as well, such as the opportunity cost of other uses for the same resources.
4. Financial Ratio Analysis
Financial ratios measure the relationship between two or more financial metrics. There are dozens of common financial ratios that measure different aspects of a business, such as profitability, liquidity, operational efficiency and long-term solvency, as well as industry-specific ratios. For profitability alone, for example, commonly used ratios include net and gross profit margin, operating margin and return on equity. It is important to select the ratios that are most applicable to the particular business and management issues at hand. The selection process is sometimes limited by the availability of good data and/or the organization’s ability to update the ratios at appropriate intervals, which can range from daily (such as for liquidity), weekly (common for efficiency) or monthly (profitability). Some ratios can be part of a one-time analysis, which is customary for solvency ratios examined for debt restructuring purposes.
5. Budget Variance Analysis
A budget is the financial companion to a company’s strategic operating plan for a fiscal period. It sets forth expectations for revenue, expenses and profits; guides resource allocations; and is a principal benchmark for comparisons to actual results. Budget variance analysis is a type of flux analysis that examines any deviations between planned results and actual results. It aims to explain the underlying causes of the variances so that business leaders can take appropriate action to correct negative variances or exploit opportunities discovered from positive variances.
6. Break-Even Analysis
Break-even analysis aims to pinpoint the level of business activity at which incremental revenue and incremental costs are equal. This analysis is often calculated when launching a new product or service, so that management understands the sales volume required to cover costs but does not yet support profits. The break-even analysis is commonly used in conjunction with market research that helps quantify customer demand and sales potential.
7. Trend Analysis
Trend analysis uses historical data to identify patterns over time, which can help business managers understand past behavior as a way to extrapolate possible future results. It’s not foolproof, but it does help shape directionally accurate thinking that can benefit a company’s future planning. Key steps involved in trend analysis include thorough, consistent data collection for multiple periods of time, use of appropriate statistical methods to identify trends and interpretation of those trends within the context of macroeconomic, industry or company conditions.
8. Sensitivity and Scenario Analysis
Sensitivity and scenario analyses are two types of financial analytics used to model changes in a business. Sensitivity analysis shows the potential impact of a change in a single variable, with all other variables held constant. For example, the owner of a small clothing boutique might use sensitivity analysis to estimate the potential reduction in sales that might occur by closing her store one day per week, likely using data from point-of-sale systems.
Scenario analysis is a more complex technique that involves extrapolating from current conditions to a whole new set of future circumstances based on changing multiple variables and underlying assumptions. In scenario analysis, multiple versions of the future are created to show a spectrum of potential outcomes, such as best-case, worst-case or most-likely. If the hypothetical boutique owner were considering opening a second location, she would build several pro forma models using scenario analysis to estimate potential outcomes and risk, assuming different levels of customer demand.
9. Investment Appraisal
Investment appraisal is one of many analytics that focus on examining the returns a company provides to its shareholders or owners. Specifically, the investment appraisal approach seeks to identify which of several competing investments has the greatest potential return and lowest risk in the context of a company’s strategic goals. It is most useful for a company with limited capital resources and must therefore make difficult choices about where to invest its capital. Investment appraisal uses various methods to quantify the value of an investment, some of which reflect the time-value of money, such as net present value, while others, such as payback period, do not discount future cash flows. As a result, investment appraisal helps business leaders make better informed decisions about how to use the company’s capital, which is why it is also referred to as “capital budgeting.”
10. Credit Analysis
Credit analysis is a process that evaluates the credit worthiness of a borrower, usually with the objective of limiting credit risk — that is, the risk that a borrower will default on a loan. Typical analytics used in credit analysis focus on leverage, such as debt-to-equity and debt-to-assets ratios. Credit analysis also looks at a borrower’s ability to cover interest charges, using financial metrics such as earnings before interest, taxes, depreciation and amortization (EBITDA), free cash flow and cash flow from operations. Credit analysis is a primary financial analytic used by lenders but is also used by borrowers for self-assessment and as part of strategic planning to determine their ability to take on additional debt.
11. Working Capital Analysis
Analyzing working capital is a primary way to gain insight into a business’s short-term health, so it is a heavily used financial analytic. Working capital is defined as the difference between a company’s short-term assets, such as cash, accounts receivable and inventory, and its short-term liabilities, such as accounts payable and accrued expenses. Positive working capital is preferred, since it means the short-term assets exceed the short-term liabilities, implying that the company can fund operations and meet short-term obligations.
12. Risk Management Analytics
Businesses of all sizes face risks outside of the universal cash flow and profitability concerns. Risk management analytics help a business identify, monitor and mitigate all kinds of risks, including, but not limited to, market risks (such as changing customer preferences and increased competition), regulatory risks, macroeconomic and geopolitical risks, workforce risks, legal risks and reputational risks. While risk management can sometimes be approached very subjectively, using financial analytics helps improve decision-making by keeping the discussion objective and data-driven. The challenge for many businesses is identifying the right drivers and data that will be useful for managing the risks that are a priority specifically for them. Examples of financial analytics techniques used for risk management include value at risk (VaR), stress testing, Monte Carlo simulations and dashboarding specific metrics. Most of these techniques are supported by advanced analytics using technologies such as AI.
Financial Analytics Benefits
A fundamental advantage of financial analytics comes from them being data-driven, which makes them objective and trackable. These characteristics help avoid faulty decision-making based solely on instincts and gut feelings. Five additional benefits of financial analytics include:
-
Enhanced Data Analysis Speed and Efficiency
Technology has increased the amount and types of data that can be collected and analyzed, as well as the speed at which results can be delivered. Especially when supported by automation, financial analytics give business leaders actionable information quickly and efficiently. The more timely financial analytic information also helps improve financial forecasts, which guide upcoming decisions, such as hiring, investments and other resource allocations.
-
Improved Data Clarity and Workflow Optimization
Financial analytics synthesize volumes of internal and external data into meaningful relationships, trends and patterns to provide insight into business results. This data clarity improves decision-making and can instigate operational changes to reduce, or improve, any processes or policies that inhibit growth and efficiency.
-
Increased Team Productivity and Decision-Making Confidence
Using clear metrics to analyze results builds accountability across an organization. With the right leadership, the application of financial analytics can help foster a company culture of continuous improvement that motivates everyone to do their part to increase productivity and profitability. It also establishes transparent metrics for measuring decisions that worked out and those that didn’t go as expected.
-
Strategic Financial Reporting and Insight
Most companies do some type of financial reporting, whether for themselves, lenders, investors or government agencies, such as the Securities and Exchange Commission. But companies that use financial analytics can also derive strategic insights from what otherwise might be considered only a compliance exercise. Those insights can help improve operations today and provide early detection of potential upcoming problems, like market volatility or liquidity crunches, better positioning the business for the future.
-
Unified Financial Management Solution
Effective financial management supports a company’s ability to set strategy for the future, make informed decisions and control the organization so it stays on course. Automated financial analytic platforms pull data from disparate sources, standardize it for consistency and then apply advanced analytic techniques to generate analyses in ad-hoc or recurring reports. The reports can serve as a single source of information for decision-making in companies that don’t already use an ERP system with an all-in-one data repository.
Financial Analytics Challenges
Over time, the roles of CFOs and their teams have expanded beyond rearview, historical accounting, reporting and compliance and now include many strategic responsibilities for generating and accelerating growth. A common new challenge is unifying and leveraging data to create forward-looking opportunities. It’s a modern-day twist on being “the numbers guy” for many CFOs and their financial planning and analysis (FP&A) teams, one that offers great promise but also comes with a number of challenges:
-
Balancing Cost Reduction With Increased Transparency
The corporate finance team is perennially asked to do more with less — or at least more with flat resources. Initiating and developing a robust financial analytics program takes time and resources, including investments in technology, data management tools and staff with the right skills. Companies that choose to make the investment will likely reap rewards, whether from identifying operational inefficiency, spotting future opportunities or simply by having better, more transparent financial management.
-
Integrating Big Data
The volume and variety of big data presents an opportunity for financial analytics, yet it is also a primary challenge. Collecting and making sense of structured and unstructured data from financial and operational systems, together with external sources, requires scalable expertise, tools and a willingness to embrace change.
-
Complex, Disconnected Financial Systems
Many organizations still deal with a patchwork of disconnected legacy financial systems and manual processes. This requires extra labor to connect siloed data, which is inefficient and introduces data-quality issues, such as errors, inconsistencies and duplication. As a practical matter, disparate systems may be technically incompatible, limiting data flow and scalability.
-
Need for Enhanced Analytical Capabilities
This is a two-part challenge involving talent and technology. Companies should evaluate their in-house talent to ensure that they possess the analytical skills required for good data analytics. If not, they’ll need to adjust existing recruitment practices to attract future employees who are proficient in data analytics and have the business acumen to interpret them. Interestingly, financial analysts and data scientists are both projected to be among the fastest-growing occupations from 2022 through 2032, increasing by 8% and 35%, respectively, according to the U.S. Bureau of Labor Statistics.
But all the talent in the world can’t help organizations that lack the right technology for performing financial analytics. These start with automated data-collection mechanisms, such as those provided by ERP systems, business intelligence tools to help interpret data, machine learning platforms to assist with predictive analytics and natural language processing tools to capture meaning from unstructured data.
-
Optimizing Financial Processes
A significant challenge that hinders widescale adoption of financial analytics is the bandwidth of the financial team. It’s widely accepted that financial analytics can provide significant benefits for a business, but day-to-day financial processes often take priority and bog down would-be analytical resources. Unless processes such as cash flow management, accounts receivable and payable processing, financial statement creation, fraud prevention and risk management are optimized through automation techniques, they can cause workflow inefficiencies that delay or deter finance team members from embracing financial analytics.
-
Evolving Role in Data Stewardship
CFOs have long been the stewards of their company’s financial matters, working to ensure fiscal health and integrity while safeguarding business assets. Financial analytics extends this responsibility, causing them and their teams to become the guardians of data integrity. After all, data-driven decision making can become irresponsible and destructive if based on bad data.
Manage All Your Financial Analytics in NetSuite ß Upsell
Financial analytics are only as good as their underlying data and the software that manages everything. A cloud-based solution like NetSuite Financial Management provides a single source of real-time financial and operational data that ensures financial analytics are based on the most timely and accurate information. Business leaders can confidently rely on the resulting reports to make the best decisions for their organizations. NetSuite’s preconfigured, role-based dashboards and KPI reporting deliver important insights, with quick time to value. Furthermore, NetSuite SuiteAnalytics provides built-in, easy-to-use tools for an assortment of analytics without requiring additional programming and technology.
The fundamental benefit for businesses that adopt the tools and processes of financial analytics is a newfound ability to uncover patterns, trends and business insights by correlating structured and unstructured data in a timely, efficient way. Quality data fuels all types of financial analytics — from simple KPIs to predictive and advanced analytics. So it’s little wonder why ensuring data integrity is a top priority for many organizations looking to start with financial analytics, especially in companies with resource constraints, disparate systems and gaps in capabilities. But with the right integrated technology and leadership focused on the future, businesses of all sizes can make the most of their financial analytics to become more efficient today and better positioned for tomorrow.
Financial Analytics FAQs
Why study finance analytics?
Financial analytics is a useful course of study that can lead to one of the fastest-growing careers, according to the U.S. Bureau of Labor Statistics. Understanding financial analytics has applications for businesses and for individuals. Business financial analytics tends to focus on improving productivity and profitability. For individuals, financial analytics can help guide individual investment decisions.
What skills are required for financial analysts?
Financial analysts need to understand accounting and finance, including budgeting, forecasting and how to read and interpret financial statement information. They must possess a good understanding of business operations and the particular market their company is in. Problem-solving, critical thinking and strong communication and interpersonal skills are also important. In addition, financial analysts should be familiar with spreadsheets, statistics and financial analysis software programs. Financial analysts typically have at least a bachelor’s degree and may also hold several professional certifications.
What does a financial analyst do?
A financial analyst collects, organizes and analyzes data to uncover trends and patterns and make recommendations to improve business outcomes. Many financial analysts work in large enterprises and focus on uncovering ways to improve profitability or productivity, using internal and external data. At investment institutions, financial analysts evaluate historical and current trends to make recommendations about buying and selling investments within a portfolio.
What is the difference between financial analyst and financial analytics?
The key difference between financial analyst and financial analytics is that the analyst is the individual and analytics is the process that the individual performs. Financial analysts perform financial analytics.