In short:
- As business conditions continue to change quickly, finance leaders are finding the forecasting process is even more critical — yet just as challenging.
- With sales history now a poorer predictor of future revenue, companies are changing their approaches to planning, resulting in more flexible and accurate forecasts.
- Rethinking forecasting methods, data collected, scenario planning, business drivers and cadence can help improve forecasts when historical data no longer proves predictive.
I recently saw an article emblazoned with the title “Business Forecasting for 2021 as if 2020 Never Happened.” Wait, what?
After reading the full article, I realized the title was somewhat misleading. However, it was enough to give me pause. You cannot forecast anywhere close to accurately without taking the game-changing events of 2020 — that have continued into 2021 — into account.
It does bring up an interesting question, though. In the past, business forecasting has been largely based on a forward projection of historical performance. Yet 2020 was an abnormal year, to say the least. For some businesses, the previous years may be partly or largely irrelevant considering the massive, permanent shifts of the past year and a half. Further, major changes continue today with the rise of COVID-19 variants, transient and possibly longer-term inflation, delays returning to the office and evolving supply chain disruptions.
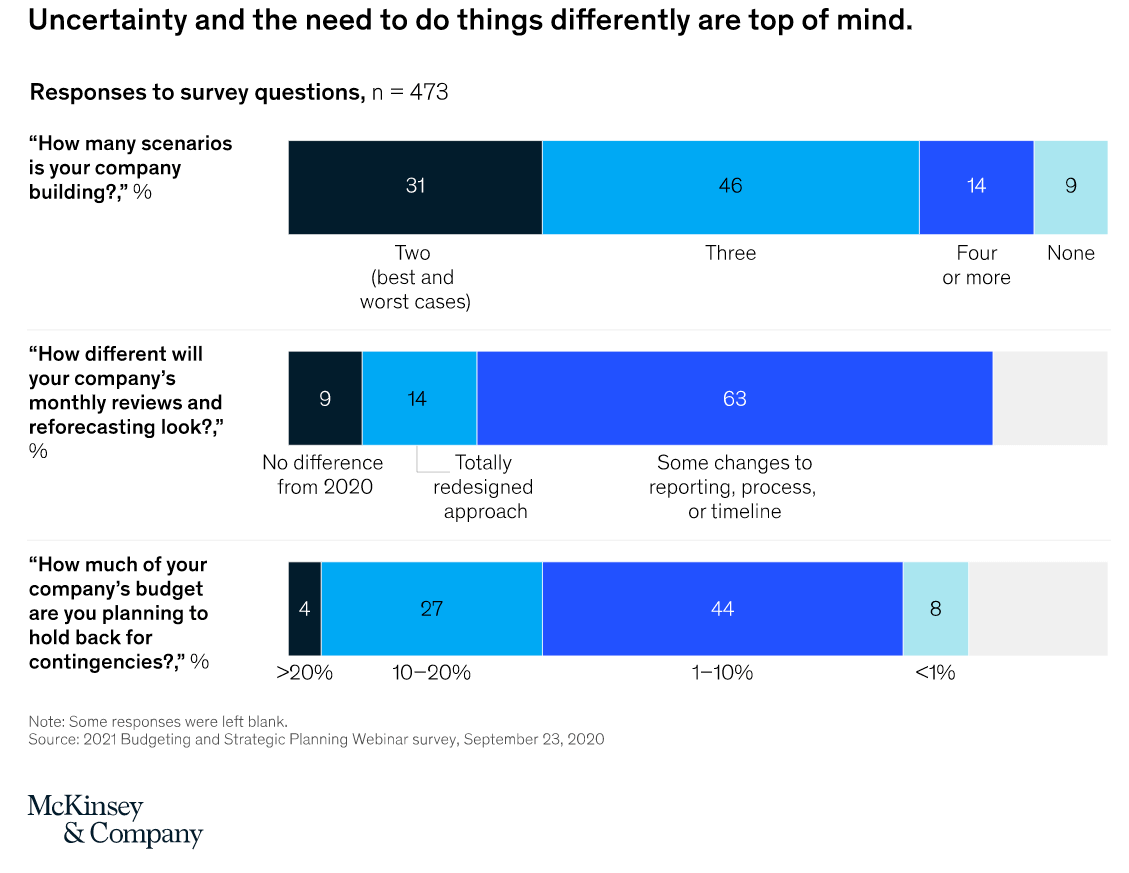
There is a way for businesses to plan, even when they find their traditional projection methods falling short. The answer lies in a reimagination of the process, say 91% of executives in a McKinsey survey, who agreed that forecasting needs to look different in 2021. Rethinking the methods, data involved, scenario plans, drivers and cadence can help produce more accurate, agile forecasts in a time of flux.
|
Our Source |
|---|
|
Dr. Valentina Fomenko, founder and CEO of
Strategy DNA |
Best Practices to Improve Business Forecasting
1. Consider additional forecasting methods
As we all know, the world is changing quickly.
"All companies are dealing with this issue — market conditions, economics, societal and cultural preferences are shifting faster and faster, impacting organizations in various ways and disrupting business models and entire industries,” said Dr. Valentina Fomenko, founder and CEO of consulting company Strategy DNA. “Past performance holds waning predictive power and can no longer be relied on for projecting the future in the same ways that it used to inform our decisions in the past.”
These changes signal the importance of ensuring your company is using the optimal methods in its forecasting approach, which entails either overhauling past methods and taking a completely new approach or choosing other methods to supplement the old ones.
Common strategies fall under either the qualitative or quantitative category:
|
Qualitative Forecasting |
Quantitative Forecasting |
|
Makes predictions based on subjective expert and customer opinion. |
Uses objective, measurable data such as market statistics, orders in hand and historical data to make projections. |
Qualitative forecasting methods:
Market research
This method involves gathering information about your target markets and customers through polls, surveys and sales teams’ talks with customers. This approach aids in predicting demand trends before they impact the business.
Delphi method
Also known as visionary forecasting — and named in homage to its Greek mythology roots — the Delphi method involves gathering opinions and recommendations from a panel of experts including project teams or customers for example, then compiling them into a forecast.
Quantitative forecasting methods:
Time series
Also known as the trend analysis method, this technique uses historical data to help predict future outcomes. A company’s financial records can indicate trends like seasonal demand fluctuations, and the business can prepare to respond to future fluctuations. Time series involves techniques like straight line, moving average, simple linear regression or multiple linear regression.
Econometric
For those craving some “Good Will Hunting”-style math, look no further than econometric modeling . The most mathematically precise method for modeling data, the econometric method uses statistical models to reveal relationships among economic variables and forecast future developments. An econometric model may look at variables like household income, consumer spending, tax rates and employment rates to understand how changes in these might impact a business. For example, a restaurant might ask whether there is a relationship between car ownership and demand for takeout, hypothesizing that low car ownership equates to more delivery orders.
Indicator
The indicator approach follows the relationship between certain leading indicators to predict the performance of lagging indicators.
|
Leading Indicator |
Lagging Indicator |
|
A KPI that points towards future events and trends |
A KPI that confirms a pattern in progress or looks back at whether the intended result was achieved |
By establishing the relationship between these variables and following leading indicators, a business can estimate the measurements of lagging indicators. For example, revenue is a lagging indicator since it’s calculated after money comes in. Customer satisfaction may be its corresponding leading indicator, because satisfied customers are more likely to repurchase and recommend the company, creating revenue.
TIP: Embrace multiple forecasting methods.
A well-rounded approach to forecasting when historical data no longer proves sufficient will embrace multiple methods — both qualitative and quantitative. Additionally, diving deep into more than one method may produce a more granular analysis — an important feature right now. Macroeconomic indicators may not accurately reflect how the different micro markets are behaving. For instance, an approach may combine market research and econometric strategy to understand how possible local restrictions may influence demand.
2. Change your data
The unusual fluctuations of 2020 threaten to increase the occurrence of GIGO, or “garbage in, garbage out,” when it comes to data. So, build a new baseline incorporating the external data that affects your business.
Case study: How incorporating external indicators into a forecast prevents major loss
Rich Wagner, CEO of forecasting and predictive analytics provider Prevedere, gave a pre-pandemic example of a recent CFO.com webinar: For a leading brick-and-mortar cosmetics company, external data indicated that the incomes of 18- to 34-year-old women were stagnating, sales were shifting from specialty stores to online and convenience stores, and prices for gas and groceries were rising. The company built an econometric model reflecting that data.
“Using Nielsen data, we could see changes in where [women shopped]," Wagner said. "That was telling us that not only was this company not going to grow at 20% next year because of these headwinds, but they [would likely see] 8% growth, for a projected $300 million revenue miss.”
The CFO then doubled down on online retail, which research showed was trending positively. Additionally, the CFO devised a contingency plan with details around pricing, promotions, inventory and staffing should growth err toward 8% vs. 20%.
Particularly now, augmenting internal, historical data with external data — such as demographic trends, changes in consumer behavior and macroeconomic fluctuations — is critical to more accurate forecasts.
TIP: Check for changing relationships.
When analyzing relationships in forecasts, note that previously accurate correlations may not be accurate in “the new normal.” For example, gas prices fell in March 2020, which led to people spending more at restaurants in the past. However, that was obviously not the case in that instance, due to lockdowns.
|
More Forecasting Resources From NetSuite |
|---|
Key Financial Forecasting Methods ExplainedGet a refresher on four time series forecasting methods, along with examples of how they play out at a business. |
Planning, Budgeting and Forecasting in the CloudStop wasting time manually consolidating spreadsheets, fixing broken links and working through endless revisions with a cloud-based planning tool — this free guide explains the transition. |
3. Plan for multiple scenarios
In speaking with financial executives about forecasting in an uncertain environment, one sentiment was common: the need for scenario planning. Many CFOs started gaming out various possibilities at the beginning of the pandemic — the CFO of the Red Sox created 20 scenario plans in spring 2020.
“It is so important to focus on scenario planning,” said Fomenko. “Rather than striving to ‘get it right,’ document and question the fundamental assumptions of your business model, market environment, regulatory regimes and consumer behavior. Ask the ‘what-if’ questions to design your organization’s response to the changing conditions. Be very careful about accepting dogma or anecdote as the ultimate truth, and make sure to question even what are truly industry best practices. Develop a healthy distrust for ‘the fundamentals.’ They may, after all, be shifting right underneath our feet."
Developing 20 scenario plans like the Red Sox may be extreme; we recommend around three. But changing public health measures, customer demand and supply chains mean businesses need to constantly revisit, assess and fine-tune these scenarios.
“A logical place [to start is] at the core of the business. Defining, evaluating and developing the plans around the scenarios is about the critical factors for maintaining, expanding and accelerating the health and well being of the business,” said Gregory Panik, VP of FP&A and accounting at CTDI, on a webinar with CFO Dive.
“So I would advocate thinking first about the value chain [or all the activities needed to create a product or service] for your organization and the critical interdependencies across all aspects of the business,” he continued, “including external relationships, customers, suppliers, regulatory agencies, and more. There are so many things you can think about that factor into the story that paints a scenario.”
While some scenario planning factors will consider macroeconomics, others will be localized and industry-specific. Incorporate both short-term perspectives regarding the next 12 months and long-term perspectives on the next three to five years. EY advises aligning scenario planning to a company’s capital allocation strategy. Forecasting should involve looking at the balance sheet, as well as the profit and loss statement. In addition to monitoring liquidity, capital allocation decisions will help companies thrive after a period of volatility.

Last year, 60% of respondents in a McKinsey survey said they were building three or more forecast scenarios for the coming year.
TIP: Ask the important questions.
Successful forecasts and scenario plans should be able to answer the following:
- What is the demand for our products and services?
- How much inventory can/should we keep on-hand, given any supply chain issues?
- What happens if the economy goes into a recession or an expansion?
- Are there immediate needs for short-term liquidity?
- How much capital will we need over the next 10 years, and how will we obtain it?
- Will the business need to raise longer-term capital?
- Will we need to reallocate capital?
- How will customer behavior change?
4. Focus on key drivers
A high-volatility environment with limited historical precedent means driver-based plans have an edge on simpler, more trend-based ones, as they allow companies to consider both internal and external drivers.
External drivers might include variables like GDP, local unemployment levels or market volatility. Internal levers — which the company can control in response to external factors — include units produced, price per unit or the number of store locations. While there is no optimal nor preferred amount of drivers, selecting a critical few trumps choosing the trivial many.
To identify your company’s key business drivers, start by looking at the balance sheet and profit and loss statement to identify your key performance indicators (KPIs) based on materiality and the business’s needs and goals. Then, determine the drivers that cause those indicators to move. Essentially, look at your company’s financial statements and ask, “What drives this line item?”
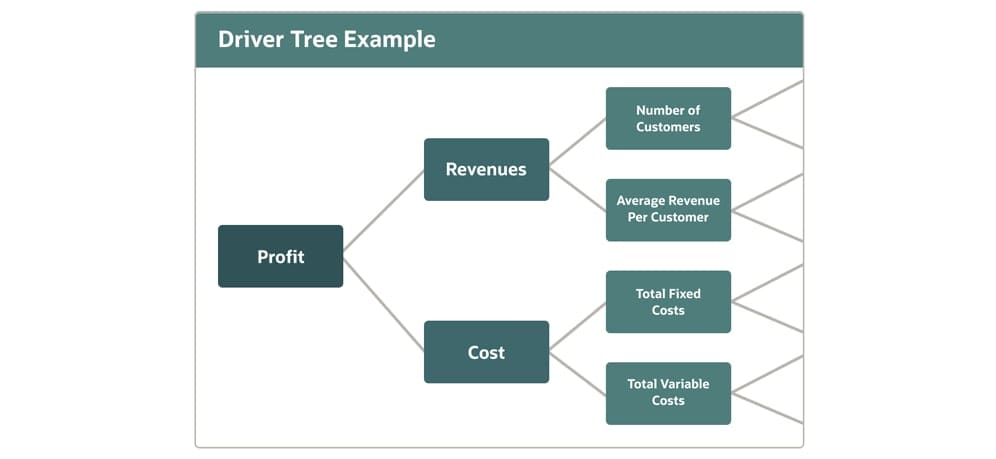
Many businesses embrace driver trees, which visually break a KPI down into drivers:

By focusing on drivers instead of just on outcomes, you can better understand the cause-and-effects that impact your business. When an external factor changes, your organization can quickly update its plans to reflect the impact that will have on internal drivers and overall KPIs.
TIP: Get other leaders involved.
Collaborating with stakeholders to determine KPIs, drivers and the forecast overall can benefit the planning process. It will help build buy-in for the forecast and the plans that will come from it. Incorporating stakeholder feedback will also aid in forecast accuracy by providing insights that finance may not have. For instance, manufacturing may know of situations that will impact supply, which will be important in building a reliable forecast.
5. Increase forecast cadence — without increasing workload
Particularly when using a driver-based approach, forecasting needs to be more frequent. Many organizations have already adopted shorter planning cycles in which forecasts are updated on a weekly or monthly basis depending on the industry. This increases accuracy and reduces the time and effort associated with the traditional annual planning process. It also allows leaders to modify objectives, plans and resource allocations to quickly respond to industry, market and economic changes and trends. General rule: The more volatile the market, the more frequent the forecast and shorter the time horizon.
When companies realize the need for more frequent forecasting, they also realize the need to refine and make the process less demanding for the finance team. Data aggregation and verification tends to be one of the most time-consuming tasks in forecasting, which validates the need for financial planning systems that quickly compile accurate data from multiple divisions.
Think about forecast cadence like driving directions: Do you want the static, outdated MapQuest printout or the dynamic, real-time Waze platform to guide you?
TIP: Consider a rolling forecast approach.
Rolling forecasts allow for a more iterative and agile forecasting process, as they involve continuously planning over a set time horizon. Since a static forecast quickly becomes obsolete in a volatile environment, a rolling forecast uses an “add/drop” approach that creates new periods continually over a set duration. For example, if a company’s rolling forecast period stretches 12 months into the future, then as each month ends, its numbers will be used to add another month to the forecast: September 2021 ends, and September 2022 is “added on.” The forecast horizon continues to roll forward based on the most current data available.
The Bottom Line
Moving forward, forecasting will look different. However, these changes mean more accuracy, agility and insights for the organization in light of shifting external factors. Planning without a reliable baseline is intimidating, but the practices involved set the finance function up to be a better strategic partner to the business in the future.


