
Financial forecasting arms executives with specific and accurate predictions they can use to make plans for the company, barring unforeseen circumstances. Those plans can affect everything from budgeting, hiring, sales goals and earnings predictions to financing decisions and institutional investment goals.
In short, financial forecasting is at the very heart of every decision executives make. Without it, they’re blindly leading the company forward and possibly off a cliff.
Financial forecasting is not a one-size-fits-all practice. It’s a collection of techniques and methods that executives choose from depending on the data they’re using and the purpose of the output.
What Is Financial Forecasting?
Financial forecasting is a process that analysts and businesses use to predict future revenues, expenses, and cash flows. Forecasts are typically based on historical data, consumer and industry trends, expected business changes, and economic conditions. By analyzing past performance and current market indicators, companies can predict their future financial position and performance, informing strategic decisions about resource allocation and growth initiatives.
While financial forecasting cannot guarantee future outcomes, it provides a structured approach for businesses to proactively navigate uncertainties and risks. Leaders turn to these forecasts to guide business decisions, from setting sales targets and planning inventory purchases to hiring and making capital investments. However, a forecast’s accuracy, and therefore usefulness, depends largely on the quality of input data and the appropriateness of the chosen forecasting method.
Financial Forecasting vs. Financial Modeling
While financial forecasting and financial modeling are related practices that work together, they serve different purposes in business planning. Forecasting specifically focuses on predicting future financial outcomes based on past results and market trends, while financial modeling creates mathematical representations of a business’s growth to analyze how different variables might affect performance. For example, a financial forecast might predict next quarter’s revenue based on last quarter’s sales and upcoming expected seasonal changes, whereas a financial model might calculate how various factors—such as a 5% price increase, 20% market expansion, and 2% economic downturn—would affect revenue.
Key Takeaways
- Financial forecasting methods range from simple calculations that extrapolate past trends to complex analyses that incorporate multiple variables.
- Businesses choose methods based on their stability, market conditions, available resources, and forecasting objectives.
- Simpler forecasting methods are easier to implement but create rigid and oversimplified results; complex methods offer deeper insights but require more knowledge, time, and resources to produce.
- Most businesses benefit from using multiple forecasting approaches that consider all available data and diverse perspectives.
What Are the 4 Financial Forecasting Methods?
Financial forecasting methods fall into two broad categories: quantitative and qualitative. Quantitative methods rely on data that can be measured and statistically analyzed. The four most common quantitative forecasting methods are straight line, moving average, simple linear regression, and multiple linear regression, each serving different purposes and offering varying levels of complexity and accuracy. Qualitative methods are subjective, incorporating expert opinions, market research, and other factors that cannot be easily quantified.
Businesses choose forecasting methods based on several factors, including their growth patterns, data availability, and goals. For example, businesses operating in volatile markets may benefit from a more sophisticated method that considers multiple factors at once. By understanding each available method, businesses can better balance accuracy with other priorities, including time investment and available resources. It’s important to note that no financial forecast is foolproof, however, and they should be taken as informed predictions, not guarantees.
1. Straight Line Forecasting Method
The straight line method is the simplest quantitative forecasting approach, estimating future results by extrapolating prior performance. This method assumes that a company’s financial metrics will continue to grow (or decline) at the same rate as in previous periods. Typically, only long-running and stable businesses use the straight line method because it ignores any upcoming changes or fluctuations.
Example of Straight Line Financial Forecasting
Straight line forecasts start with current performance metrics, such as revenue or cost of goods sold. Then those figures are extended out based on current growth trends, following this formula:
Forecasted performance = Current performance × (1 +/- Current growth/decline rate as a decimal)
For instance, if a restaurant’s current annual revenue is $1 million and it has experienced consistent 5% annual growth, its three-year straight line forecast would be:
Year 1: $1,000,000 × (1 + 0.05) = $1,050,000
Year 2: $1,050,000 × (1 + 0.05) = $1,102,500
Year 3: $1,102,500 × (1 + 0.05) = $1,157,625
Advantages and Disadvantages of Straight Line Forecasting
The primary advantage of straight line forecasting is its simplicity and ease of implementation. It requires minimal data and basic mathematical skills, making it accessible for small businesses new to financial forecasting or for on-the-fly projections and comparisons. However, its simplicity can also be a disadvantage, as straight line forecasts ignore any market volatility, seasonal fluctuations, or changing economic conditions. As a result, it’s most reliable for established businesses with historically stable growth patterns and may be too rigid for companies in dynamic industries.
2. Moving Average Forecasting Method
A moving average is the calculation of average performance around a given metric in shorter time frames than the straight line method, such as days, months, or quarters. It is not used for longer time periods, such as years, because that creates too much lag for it to be useful in trend following.
This method is used to create a constantly updated average of values with a lot of movement, such as stock prices, as well as values that fluctuate often but not quite as quickly, such as inventory levels during peak retail periods.
In short, this method helps identify underlying patterns that can be used to evaluate common financial metrics, such as revenues, profits, sales growth, and stock prices. A rising moving average indicates an uptrend, whereas a falling moving average points to a downtrend.
Example of Moving Average Financial Forecasting
To calculate a metric’s moving average, take its mean over the given time period, following this formula:
Moving average = Sum of values in chosen time periods / Number of periods
If a retailer wants to forecast weekly inventory needs based on the prior four weeks of sales, it can calculate it like this:
Week 1 sales: 90 units
Week 2 sales: 125 units
Week 3 sales: 80 units
Week 4 sales: 125 units
Moving average = (90 + 125 + 80 + 125) / 4 = 105 units expected for Week 5
Assuming that forecast was accurate, the retailer can replace the first week with the most recent data to maintain a four-week moving average, showing that overall sales are trending up.
Moving average = (125 + 80 + 125 + 105) / 4 = 109 units expected for Week 6
Advantages and Disadvantages of Moving Average Financial Forecasting
The primary advantage of moving average forecasting is its ability to reduce—but not eliminate—the impact of short-term fluctuations and reveal underlying trends over time. This model is particularly useful for businesses with seasonal variations or frequent data changes, such as retail operations, where flexibility and responsiveness can be a major competitive advantage. However, this method can delay the recognition of sudden shifts, partly because it gives equal weight to each period in the calculation. Additionally, it requires consistent, frequent data collection and regular updates, potentially leading to undiscovered long-term patterns. Because of this, it’s most reliable for short-term operational forecasting, rather than longer-term strategic planning.
3. Simple Linear Regression Forecasting Method
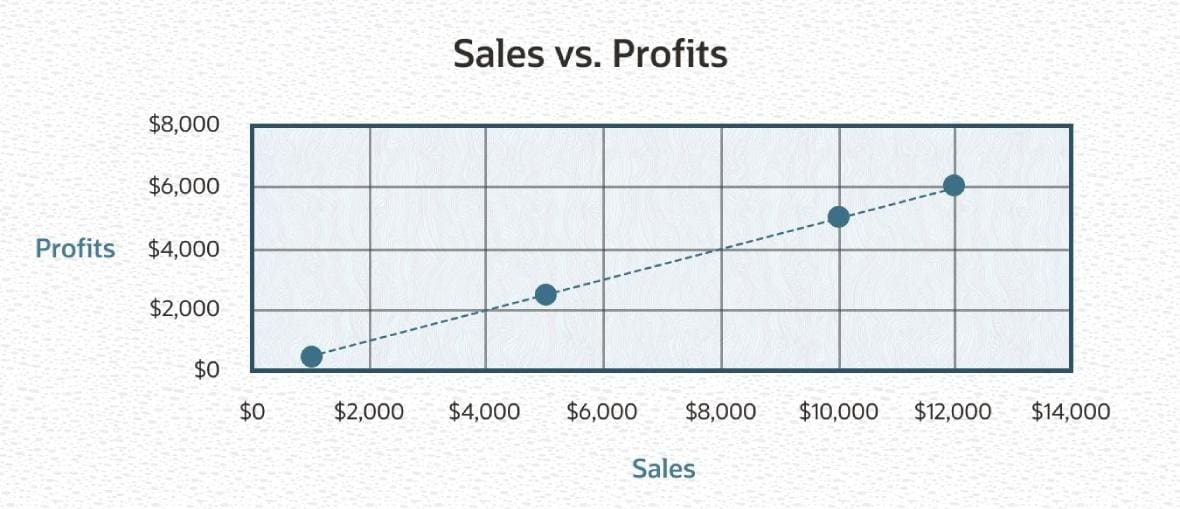
A simple linear regression creates a trend line based on how changes in one independent variable, such as sales, affect a dependent variable, such as profit. This line is graphed on a set of axes, with the independent variable along the bottom (X-axis) and the dependent variable along the side (Y-axis). Businesses use this graph to make predictions about future performance based on planned operational changes to the independent variable.
Example of Simple Linear Regression Forecasting
Sales and profits are two variables that are key to the success of every company. To create a simple linear regression forecast using sales and profit data, plot historical sales figures against profit to create a trend line. This line shows the relationship between the two variables. If the trend line rises, then all is well for the company and margins are strong. If it falls because sales are up but profits are down, something is wrong; perhaps there are rising supply costs or narrow margins. However, if sales are down but profits are up, the value of the item is trending upward. This means the company’s expenses/costs are down and the linear regression is good—the margin percentage is up when profits are up.
For instance, if a company’s regression model shows that for every $10,000 increase in sales, the business earns a $5,000 increase in profit, it can be estimated that each sales dollar yields $0.50 in profit. Therefore, an upcoming $12,000 sale will lead to a projected $6,000 profit increase ($12,000 x [$5,000 / $10,000]).
Advantages and Disadvantages of Simple Linear Regression
Simple linear regressions allow businesses to quantify cause-and-effect relationships in their operations, which helps them estimate the impact of their strategies when allocating resources and making investments. However, because they consider only one independent variable, simple linear regressions don’t necessarily consider the complexity of business relationships, impacting their accuracy. Additionally, they assume a correlated relationship between variables, which isn’t always the case in real-world scenarios. With this in mind, a simple linear regression is most reliable when the relationship between the chosen variables is clear.
4. Multiple Linear Regression Forecasting Method
The multiple linear regression method uses more than two independent variables to make a projection, creating a model of the relationship between independent explanatory variables, known as parameters, and the dependent response variable, called the outcome. By analyzing multiple factors simultaneously, this method provides more nuanced and accurate predictions than simpler forecasting approaches. That said, it is the most complex of the four.
Example of Multiple Linear Regression
A trucking company executive wants to predict fuel costs in the next six months. For this forecast, the exec chooses four independent variables: the EIA Gasoline and Diesel Fuel Update, mileage from GPS fleet-routing systems, traffic patterns from smart city open data platforms, and the truck fleet required to make projected deliveries. For this period, the data shows a 7% decrease in gas prices, a 5% increase in mileage from both routing changes and traffic patterns, and 15% more trucks on the road, resulting in a projected 13% increase in total fuel costs. (Note that these models often include many more independent variables that may also affect the outcome.)
Advantages and Disadvantages of Multiple Linear Regression
Multiple linear regression models account for myriad factors simultaneously, providing a more comprehensive analysis than simpler methods. This makes it more appropriate for complex business environments where many variables can impact results. Multiple linear regression models require more sophisticated statistical knowledge and computing power, along with an understanding of which variables are truly significant and how they impact each other. As a result, this method is resource-intensive and requires expertise to implement effectively. Many businesses rely on software with built-in forecasting capabilities, such as an enterprise resource planning (ERP) system, to minimize the manual effort required to generate these forecasts without compromising accuracy.
Qualitative Forecasting Methods
By their nature, qualitative forecasting methods are less precise than quantitative ones. They’re as much art as imprecise science. That is not to say, however, that they are less useful. For example, a doctor learns from experience the telltale signs of a certain disease, which drives his decision to order certain tests. The doctor may also suspect one disease over another because one is common in the local area, even if it’s uncommon nationally.
Similarly, business executives develop expert knowledge from experience pertaining to their industry or product line. This information is not necessarily measurable nor confirmed by historical data, but it has business value nonetheless.
Qualitative forecasting methods use or combine soft data, such as expert estimates or opinions, with hard data, such as machine data or sales data, to make projections that are usually applied to short-term business predictions.
Examples of qualitative forecasting methods include:
- Delphi method: This approach brings together multiple experts to share predictions over multiple rounds of questionnaires or surveys, with feedback provided after each round. The experts remain anonymous to reduce bias and imbalanced influence on the final forecast. While this method can provide valuable consensus from industry experts, it often requires significant time and resources to coordinate multiple rounds of feedback and analysis.
- Market research: This method combines customer surveys, focus groups, and field testing to understand future purchasing intentions and product reception. While customers may not always follow through on their stated plans, this research can provide valuable insights into market and demand trends, as well as customer preferences and behaviors.
- Jury of executive opinion: This technique brings together senior executives from different departments to create forecasts based on their combined experience and knowledge. Unlike the Delphi method, these groups work openly and collaboratively, coming to a group consensus. While this can potentially lead to biases from internal politics or groupthink, these juries can quickly infuse diverse perspectives and institutional knowledge into the forecasting process.
Choosing the Right Forecasting Method for Your Business
Leading businesses rely on software to streamline their financial forecasting processes. With NetSuite Financial Management, businesses can create accurate forecasts based on wide-reaching financial data, gaining insights that can be applied to specific departments or throughout the organization to optimize growth while minimizing risk. Additionally, NetSuite’s built-in financial reporting capabilities allow analysts and forecasters to confidently predict future growth based on a solid foundation of comprehensive, up-to-date financial data. Automated revenue management, billing, and real-time analytics are also part of the AI-powered cloud solution.
Business leaders rely on financial forecasts to make decisions about the future, but which forecasting method works best depends on a variety of factors, including the company’s complexity, available resources, and priorities. Simpler methods may work well for stable businesses with consistent data, but companies with more intricate relationships and operations may require more nuanced and sophisticated methods, often aided by financial tools that consider multiple variables at once when generating forecasts. For the most reliable results, businesses often combine multiple forecasting methods with qualitative insights from market research and expert opinions. This even-handed approach helps businesses balance accuracy with other priorities, such as available data and resources, to find the forecasting method that best fits their needs.
Financial Forecasting Methods FAQs
What is the simplest financial forecasting method?
Of the four most common financial forecasting methods, the straight line method is the simplest, as it only requires basic mathematical calculations and historical data. This method assumes a company’s growth rate will remain constant, making it particularly useful for stable businesses with predictable growth patterns. That said, it’s important to note that the straight line method does not account for market volatility or sudden changes in business conditions, so it can be less accurate than more complex methods.
What is the most widely used method for financial forecasting?
Generally speaking, multiple linear regression is the most widely used financial forecasting method among established businesses because it considers multiple variables simultaneously, leading to more nuanced predictions. Analysts use this method to account for factors including market conditions, seasonal variations, economic indicators, and internal performance metrics. Its popularity stems from its ability to provide more comprehensive insights than simpler methods, even though it requires more involved calculations and analysis.
What is the most accurate financial forecasting method?
The most accurate financial forecasting method will depend on the business, available data, and specific forecasting needs. While multiple linear regression often provides the most accurate results for complex companies, businesses with consistent growth and stable market conditions may find simpler methods, namely straight line forecasting, equally accurate. Finding the method with the right balance between accuracy and resource strain requires decision-makers go beyond just considering the method and also assess available data quality and which methods best align with the business.