
Research from Ardent Partners shows that every new dollar of spend placed under a procurement team’s control can result in savings of between 6% and 12%, as well as improved quality and lower risk. Those are numbers that could make or break profitability.
Procurement dashboards provide real-time visibility into everything from supplier performance to spending patterns, turning procurement from a reactive function into a proactive, cost-saving engine and allow companies to streamline processes, improve decision-making and potentially save a significant chunk of their procurement budget.
What Is a Procurement Dashboard?
A procurement dashboard pulls together all the key data within a particular procurement activity, such as supplier performance, spending trends, purchase orders (POs), contract compliance and delivery timelines. The result is a real-time snapshot of where a company’s money is going, how suppliers are performing and whether orders are getting processed smoothly. Instead of staff manually sifting through endless reports, procurement dashboards translate critical metrics, such as total spend, savings, supplier performance and order timelines, into clear, visual displays. Charts and graphs make it easy to spot patterns, pinpoint bottlenecks and uncover hidden opportunities.
Procurement dashboards are more than reporting tools, however; they’re a strategic asset. They give teams the power to act quickly, adjust on the fly and make decisions that both improve efficiency and cut costs. That’s the beauty of dashboards: They turn data into action, helping companies stay ahead of the curve in an ever-shifting market that rewards agility.
Key Takeaways
- A procurement dashboard creates a visual representation of critical procurement data, providing users companywide with real-time insights into corporate spending.
- Procurement dashboards turn critical insights into action, such as holding suppliers accountable, reining in costs or catching inefficiencies before they become larger issues.
- There are many types of procurement dashboards, each addressing specific aspects of the procurement process. Examples include source management, purchase management, invoice processing and vendor management.
- Some of the top key performance indicators (KPIs) to track on a procurement dashboard include PO accuracy, PO cycle time, supplier lead time and supplier defect rate.
Procurement Dashboard Explained
Procurement dashboards offer real-time insights to users across an organization, from procurement managers to finance directors. For example, IT managers and analysts may use them to evaluate system performance, while CFOs and business owners might use them to monitor costs and identify savings opportunities. With global demand for procurement systems on the rise, and market growth projected to jump from $8.03 billion in 2024 to $18.3 billion by 2032, companies are increasingly adopting these tools to gain better control over external spending.
Typically, procurement systems and dashboards are part of a larger software suite, such as an enterprise resource planning (ERP) system or procurement management system. ERP and procurement systems integrate data from multiple sources, including supplier management platforms, financial systems and inventory tools, and feed procurement dashboards with up-to-date information. The data in a dashboard often includes anything from spending breakdowns to supplier performance metrics, contract details and order status. Armed with this data, companies can track how much they’re spending, whether orders are on time and how well suppliers meet expectations.
While procurement dashboards are often tailored to specific functions, such as PO management, source management or invoice processing (more on this below), they can also be integrated into a single, unified procurement dashboard. In most cases, this is done using an ERP system. A unified procurement dashboard can be customized to consolidate key data from multiple specific dashboards to give businesses the power to make informed decisions and optimize procurement processes.
Why Are Dashboards Important in Procurement?
Imagine trying to track procurement activities across dozens of spreadsheets, searching for the latest supplier data or manually piecing together spending patterns. It’s the kind of time-consuming, error-prone process that leaves financial decision-makers feeling stressed and constantly behind the curve. Relying on manual methods or disconnected systems to manage procurement data isn’t only cumbersome; it also makes it nearly impossible to react to changes in real time. Disconnected systems create data silos, making critical insights harder to access and collaboration more challenging. As a result, companies run a much higher risk of overspending, missing deadlines and squandering opportunities for savings.
Rather than manually tracking supplier performance through separate spreadsheets and emails, a vendor management dashboard automatically aggregates real-time data on supplier delivery times, quality ratings and contract compliance. This allows decision-makers to act quickly and confidently, without having to second-guess whether they’re working with the most up-to-date information.
Benefits of Implementing a Procurement Dashboard
A procurement dashboard is not just a visual tool; it’s a critical way for companies to manage the procurement life cycle. It brings critical insights into focus, whether that means keeping suppliers accountable, tightening cost control or spotting inefficiencies before they escalate. Using a procurement dashboard can provide the following benefits.
- Greater insight into suppliers: Procurement dashboards can give companies instant visibility into a host of key metrics related to supplier performance, including delivery times, defect rates, order accuracy, pricing consistency and contract compliance. For example, if a supplier regularly misses deadlines or falls short on quality, the dashboard quickly flags the issue so procurement teams can take swift action — perhaps renegotiating terms or finding new partners.
- Increased profitability: A well-designed procurement dashboard can uncover cost-saving opportunities that might otherwise slip through the cracks. For example, a company might discover that consistently buying from one supplier at scale saves money, or it might spot areas where it’s overspending due to pricing inconsistencies.
- Effective cost management: A dashboard brings clarity by offering a real-time breakdown of how much is spent and where the money is going. Instead of sifting through outdated reports, companies can quickly spot areas where costs are creeping up or where budgets are being stretched too thin, or where actual and expected costs vary. For example, if material costs are rising from a certain supplier, the dashboard flags it so the procurement team can renegotiate or find alternatives.
- Strengthened supplier relationships: Strong supplier relationships are built on real partnerships, and a procurement dashboard helps make that happen. With real-time data at their fingertips, companies can see exactly how suppliers perform, from on-time deliveries to product quality. And it’s not just about addressing poor performance; it’s about rewarding good performance, too. Recognizing a supplier’s excellent track record can make routine orders part of a deeper partnership.
- More accurate variance identification and analysis: Spotting variances in procurement becomes much easier with a dashboard that highlights discrepancies as they happen. These can include unexpected price hikes, delayed deliveries or order inconsistencies, all of which can be brought to light in real time by a dashboard. For example, if a supplier’s invoice doesn’t align with the PO or the goods received — a concept known as three-way matching — a dashboard will immediately flag it for further investigation. This instant visibility allows procurement teams to dig deeper, address the root cause and adjust strategies as needed.
Challenges Addressed by Procurement Dashboards
Whether to improve communication with suppliers, enhance data accuracy or cut unnecessary spending, procurement dashboards serve as a powerful tool for streamlining complex processes. Here are five common procurement challenges and how dashboards can address them.
- Improving supplier communication: Supplier communication can easily fall apart if information is scattered and there’s no clear visibility into orders. A procurement dashboard with shared views bridges that gap by offering real-time data, so procurement teams and suppliers have a single source of truth. Take the example of a delivery that’s running late. Instead of finding out after the fact, both sides can get an instant update through the dashboard. The benefits are twofold: Operations stay on track, and supplier relationships are strengthened thanks to clear collaboration.
- Reducing unnecessary spending: Without visibility into purchasing, rogue spending can sneak up on companies. A procurement dashboard cuts through the fog, giving teams a crystal-clear view of spending in real time. Without a procurement dashboard, a company might not notice that a certain department is routinely overordering supplies until the budget’s already stretched. With a dashboard in place, however, procurement teams can spot patterns early and stop waste before it happens.
- Enhancing data accuracy: In procurement, keeping sensitive data secure can feel like walking a tightrope — one misstep and critical information could be exposed. A dashboard helps maintain balance by centralizing data in one secure place, with access granted only to those who need it. No more emailing spreadsheets that can be lost or mishandled. With a dashboard, supplier and financial data are protected in a secure environment.
- Managing supplier performance: A recent study in Europe noted that small to medium-sized businesses can typically have up to 800 suppliers, which can complicate vendor management. A procurement dashboard eases this situation by offering real-time insights into every supplier’s track record. Instead of relying on outdated reports or gut feelings, a dashboard highlights KPIs, such as on-time delivery rates and product quality, so procurement teams can see which suppliers are delivering and which are falling short without the need to run historical reports. If a supplier starts slipping, a dashboard raises a red flag, allowing teams to address issues quickly to keep performance on track.
- Streamlining manual processes: Manual procurement processes can be a significant time drain, forcing teams to chase down approvals, track orders in spreadsheets and reconcile invoices by hand. It’s tedious, prone to errors and grinds finance operations to a halt. A procurement dashboard cuts through that clutter by automating key steps. No more chasing paper trails or manually matching invoices to POs.
Procurement Dashboard Examples and Features
Procurement dashboards come in many forms, each designed to address specific aspects of the procurement process. The following examples highlight the most common procurement dashboards and the benefits each provides.
Source Management Dashboard
A source management dashboard is like a command center for sourcing decisions, giving procurement teams real-time visibility into everything from supplier bids to contract performance. Instead of juggling spreadsheets and emails, the dashboard centralizes data to allow teams to compare bids, track supplier credentials and monitor contracts at a glance. Whether choosing suppliers for a new project or renegotiating contracts, the dashboard speeds up decision-making and keeps everything aligned. Consider a company evaluating multiple suppliers. With a dashboard, the company can quickly compare pricing, review supplier performance and check compliance all from one spot. This means smarter supplier choices, better contract management and fewer sourcing headaches.
Purchase Management Dashboard
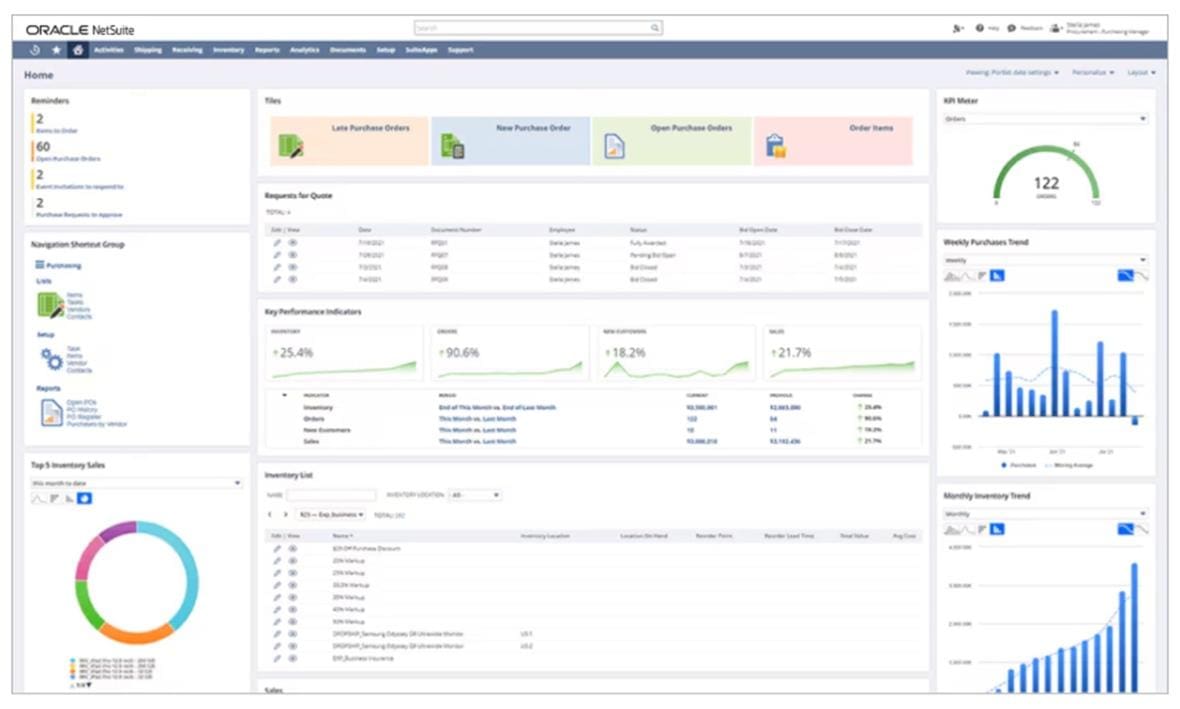
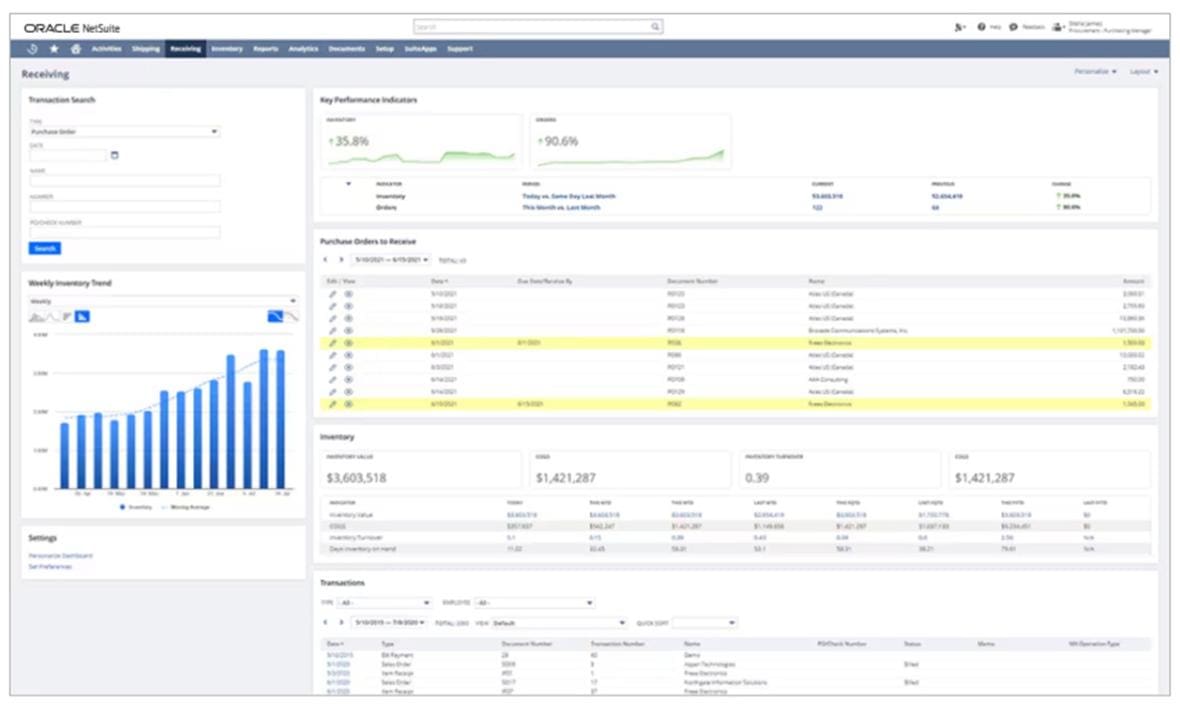
One of the key goals of procurement is to transform purchasing from a scattered process into a streamlined, automated workflow where every order is on track, on budget and on time. A purchase management dashboard puts the entire process at the procurement team’s fingertips, making it easy to oversee every purchase from request to delivery. Imagine a company that manages hundreds of orders a month. A purchase management dashboard shows which orders await approval, which are on their way and where spending might be increasing. This visibility means quicker approvals, fewer delays and tighter budget control. Instead of forcing staff to chase down approvals or sort through POs manually, the dashboard centralizes everything — approvals, order tracking and spending — in real time. It’s like having a bird’s-eye view of the entire purchasing pipeline that procurement teams can use to keep things moving smoothly.
Invoice Processing Dashboard
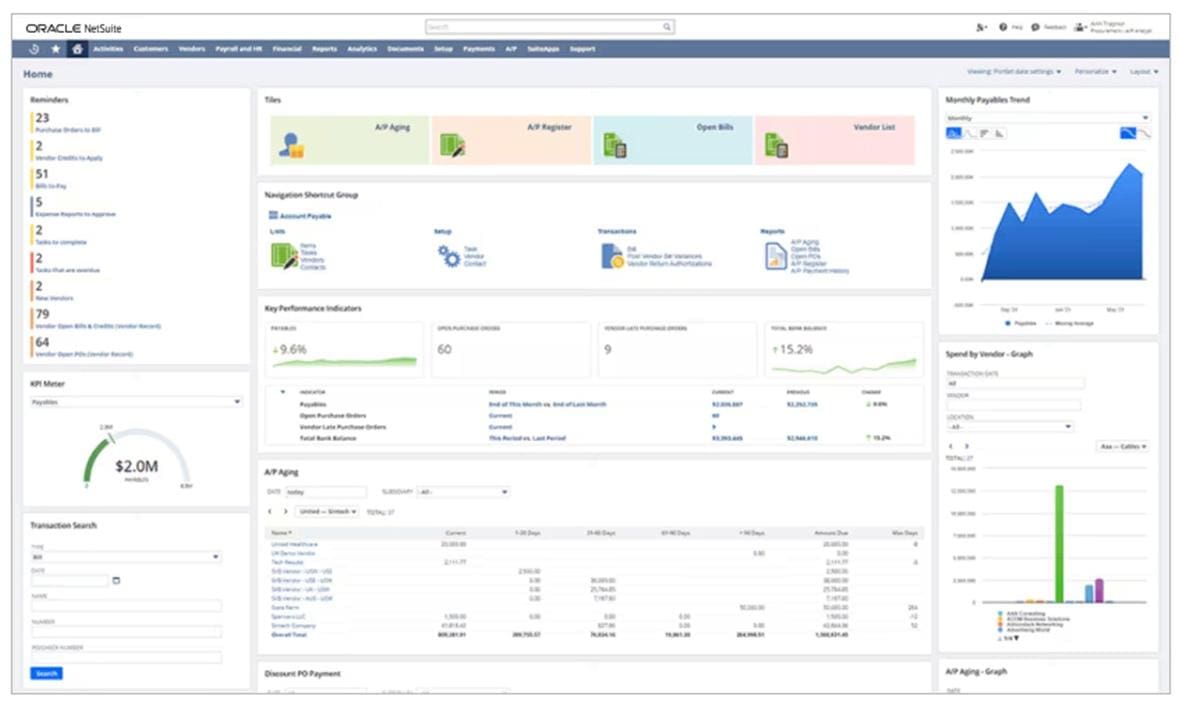
Companies often deal with invoices from various suppliers, each with different terms, formats and timelines. It’s no wonder invoice processing is one of the more chaotic tasks in finance. With an invoice processing dashboard, a business can track invoice status, verify approvals and flag discrepancies all in one place, instead of juggling piles of paperwork or manually matching invoices to POs. For example, if a company deals with hundreds of invoices each week, a dashboard instantly shows which invoices are pending approval, which are overdue and whether there are mismatches between an order and its invoice. As a result, teams can spot issues early, resolve them fast and ensure that suppliers are paid on time, keeping relationships strong.
Vendor Management Dashboard
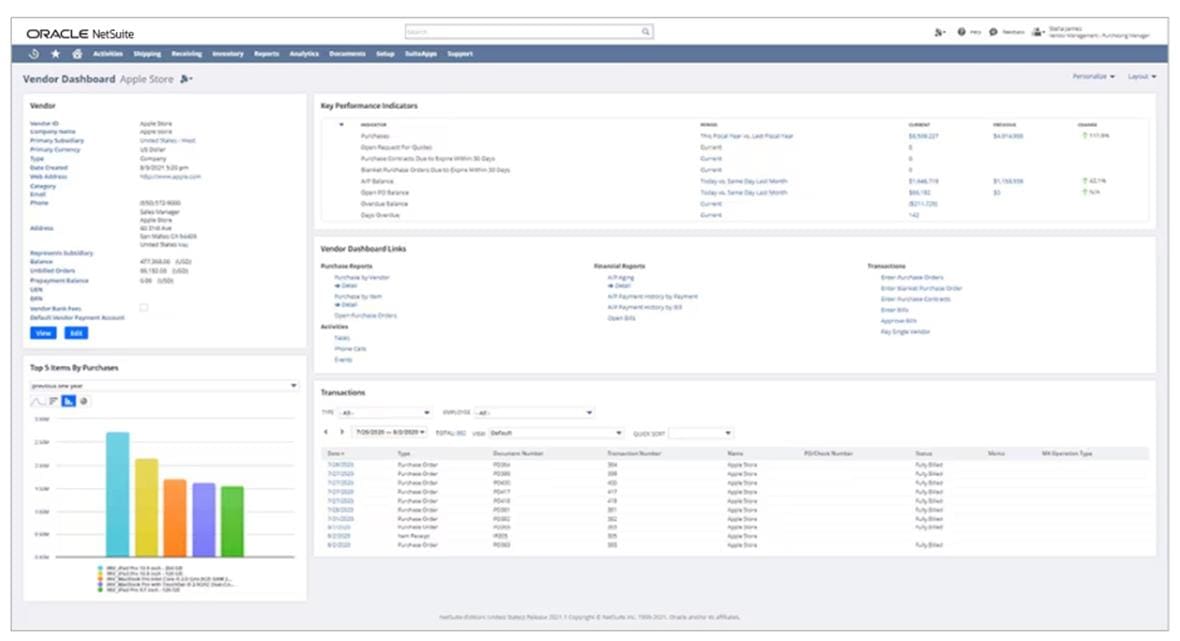
A vendor management dashboard gives companies a clear, real-time view of their supplier relationships, pulling together essential data, such as delivery performance and contract terms, into one central hub. No more sifting through emails or outdated spreadsheets. This dashboard gives procurement teams insights into how vendors are performing and flags any potential issues, like late shipments or rising costs, so companies can tackle problems early. It also tracks contract renewal dates and KPIs, making it easier to decide which vendor relationships are worth maintaining and which might need renegotiation.
Top 10 KPIs to Include in a Procurement Dashboard
Tracking the right KPIs in a procurement dashboard results in invaluable insights into the efficiency and effectiveness of procurement operations. Here are 10 key KPIs that businesses should track to streamline purchasing, manage suppliers and improve profitability.
1. Purchase Order Accuracy
PO accuracy tracks how often POs align with invoices and receipts without any mix-ups or surprises. It’s a vital KPI in a procurement dashboard because it highlights how smoothly a company’s buying process runs. When accuracy is high, it means orders are being placed and fulfilled exactly as intended, avoiding costly mistakes like overpaying or product delays. Keeping this KPI in check means fewer headaches and stronger supplier relationships. If a company consistently gets orders right, with no billing disputes or missing items, it leads to faster supplier payment, smoother operations and more trust between buyers and suppliers. Monitoring PO accuracy also helps businesses catch inefficiencies before they spiral out of control.
A basic formula for PO accuracy is:
PO accuracy = (Number of accurate POs / Total number of POs) x 100
For instance, if, out of 100 POs, 95 were received exactly as ordered, the PO accuracy would be 95%, or (95/100) x 100.
2. Purchase Order Cycle Time
The speed and reliability of a supplier’s deliveries can make or break a business’s ability to stay on schedule. That’s where tracking PO cycle time becomes invaluable. By keeping a close watch on how long it takes suppliers to fulfill orders, companies can anticipate potential delays and adjust their operations accordingly. When times are predictable, production runs well; when they’re not, it can cause costly disruptions. Imagine a company using its procurement dashboard to monitor PO cycle times. If a supplier begins to take longer than expected to deliver, the dashboard immediately flags the shift. This allows the company to take proactive steps, whether that’s adjusting timelines or seeking alternative suppliers, before any real damage is done.
A typical formula to calculate PO cycle time is:
PO cycle time = Date PO is closed or fulfilled – Date PO is created
3. Supplier Lead Time
The time it takes for a supplier to deliver once an order is placed can have a huge impact on how efficiently a business operates. Supplier lead time captures this window and is a vital KPI for maintaining efficient production and inventory management. Longer-than-expected lead times can result in stockouts or production delays, while shorter, consistent lead times can keep things chugging along without incident. A company that needs materials for a product launch can use a procurement dashboard to monitor lead times closely. If a supplier starts lagging behind, the dashboard highlights the delay immediately so the company can act before it affects the launch timeline. This keeps the company nimble, reduces downtime and avoids scrambling to fix unexpected supply chain hiccups.
Supplier lead time can be calculated using this formula:
Supplier lead time = Date of order receipt – Date of order placement
4. Supplier Defect Rate
The consistency and reliability of supplier deliveries can have a ripple effect throughout the entire supply chain, making supplier defect rate a critical metric to watch. This KPI measures the percentage of goods received from a supplier that fail to meet quality standards, and it can quickly reveal whether a supplier’s performance is slipping. High defect rates can lead to delays, rework and higher costs. If a supplier starts delivering faulty products, a dashboard flags the issue early so the company can step in and address the problem before it affects production. By closely monitoring this KPI, companies can maintain higher quality standards, reduce waste and keep operations running without costly snags.
A basic formula for supplier defect rate is:
Supplier defect rate = (Number of defective units / Total number of units received) x 100
For instance, if a supplier delivered 1,000 units and 50 of them were found to be defective, the calculation would be (50/1,000) x 100 = 5%, indicating a supplier defect rate of 5%.
5. Vendor Late Purchase Order Rate
Vendor late PO rate is a KPI that measures how often a supplier misses agreed-upon delivery dates, giving companies a clear picture of their partners’ reliability. Frequent late orders can cause disruptions, from production slowdowns to missed customer deadlines. Using a procurement dashboard to track vendor performance, a company can quickly identify a supplier that consistently delivers late and take immediate action, whether that’s renegotiating terms, adjusting timelines or finding a new vendor, before delays turn into costly problems.
Vendor late PO rate can be figured out using this formula:
Vendor late PO rate = (Number of late POs / Total number of POs) x 100
For example, if a supplier had 10 late POs out of a total of 100 POs, the calculation would be (10/100) x 100 = 10%. This means the supplier’s late PO rate is 10%.
6. Vendor Performance Index (VPI) Fill Rate
A vendor’s ability to consistently deliver full orders on time can spell the difference between smooth operations and unexpected bottlenecks. That’s where the vendor performance index (VPI) fill rate comes in. It tracks how well suppliers are fulfilling orders as requested, without partial shipments or substitutions, giving a clear picture of how dependable vendors are over time. For example, imagine a manufacturer facing a crucial production run. If a supplier begins falling short on order fulfillment, the procurement dashboard immediately reflects this shift. Rather than waiting for production delays to surface, the company can address the supplier’s issues early, seeking alternatives or renegotiating terms.
Companies can use the following formula to calculate VPI fill rate:
VPI fill rate = (Number of items delivered on time and in full / Total number of items ordered) x 100
For instance, if a vendor delivered 90 items on time and in full out of 100 items ordered, the calculation would be (90/100) x 100 = 90%, indicating a VPI fill rate of 90%.
7. Spend Under Management
Actively tracking a company’s total procurement spending is critical to long-term cost efficiency. Spend under management measures the percentage of a business’s spending that’s fully managed through structured procurement processes, ensuring that purchases are made under approved contracts and with vetted suppliers. The higher the percentage, the more control a company has over its procurement costs. By using its procurement dashboard to track spend under management, a company can detect when departments make off-contract purchases with unapproved suppliers that drive up expenses. With this insight, the business can bring more spend into the fold, renegotiate contracts and tighten up procurement policies. The result is better cost control, less rogue spending and greater value from supplier relationships.
Here’s a formula to calculate spend under management:
Spend under management = (Total spending managed by procurement / Total company spending) x 100
Say a company’s total spending is $10 million, and the procurement department manages $8 million of that spending. The calculation for spend under management would be ($8 million/$10 million) x 100 = 80%. This indicates that 80% of the company’s spending is being managed by the procurement department.
8. Procurement ROI
When it comes to evaluating the effectiveness of procurement efforts, procurement return on investment (ROI) is a key metric that shows how much value procurement activities deliver in relation to their cost. It’s the ultimate gauge of efficiency, revealing whether the strategies and systems in place generate significant returns or just add overhead. Consider a company that recently overhauled its procurement process with new tools and systems. By tracking procurement ROI in its dashboard, managers can see to what extent those changes are actually paying off. Are the savings outweighing the costs? Have supplier negotiations led to better deals? If procurement ROI is on the rise, it confirms that the investments are delivering tangible benefits. Unlike other KPIs, procurement ROI paints a big-picture view of whether procurement is truly driving growth and profitability for the business.
Procurement ROI can be calculated with this formula:
Procurement ROI = (Cost savings / Total procurement investment) x 100
For example, if a procurement department achieved $500,000 in cost savings with a total investment of $100,000 in procurement resources and technology, the calculation would be ($500,000/$100,000) x 100 = 500%. This means the company’s procurement ROI is 500%.
9. Shipping Cost Value
If not carefully monitored, shipping costs can quietly eat away at a company’s bottom line. For example, in recent months, container freight rates fluctuated dramatically. In October 2023, the average rate for a 40-foot container was $1,342. By July 2024, however, the rate hit $5,900, the highest on record. Shipping cost value tracks how much a business spends on shipping relative to the value of the goods transported. When shipping costs creep up without a corresponding increase in value, profitability takes a hit. Using a procurement dashboard to track shipping cost value, companies can identify shipments that cost far more than they should, especially for certain suppliers or routes. As a result, they can optimize shipping strategies, whether by negotiating better rates, consolidating shipments or finding more cost-effective routes.
Here’s a basic formula to calculate shipping cost value:
Shipping cost value = Base shipping rate + Additional fees
In this case, additional fees could include fuel surcharges, insurance, handling fees or customs duties.
10. Inventory Level
Maintaining the right inventory levels is a balancing act that can make or break the efficiency of a business. This metric tracks the amount of stock a company holds at any given time, making sure there’s enough to meet demand without overstocking and tying up cash. The goal is to strike that sweet spot where inventory supports production and sales without creating excesses or shortages. Picture a retail company preparing for the holiday season. Instead of guessing how much stock to order, it uses its procurement dashboard to monitor inventory levels in real time, tracking sales trends and supplier lead times. If a particular product is flying off the shelves, the dashboard highlights the need for a restock, preventing a potential stockout. On the flip side, it also flags slow-moving items, helping avoid overordering and reducing excess inventory.
Inventory level can be figured using this basic formula:
Inventory level = Beginning inventory + Received inventory – Sold inventory
Choosing the Right Procurement Software
Choosing software is about finding a solution that addresses today’s challenges as well as tomorrow’s, and the process for procurement software is no different. Start by identifying specific procurement pain points, whether that’s managing a growing list of suppliers, automating approvals or getting a more accurate view of spending patterns. With a clear understanding of what needs to be solved, the search for the right software becomes more focused. Integration is another key piece of the puzzle. The ideal procurement system should connect seamlessly with existing platforms, such as accounting or inventory software, to create a streamlined flow of data that boosts efficiency. Simplicity matters, too: Software should always enhance operations, not complicate them.
Critical features to consider include real-time analytics, supplier performance tracking and automated workflows that simplify everyday tasks. And a flexible, customizable dashboard gives teams the tools they need to stay agile. Cloud-based procurement solutions offer greater flexibility, allowing teams to access the system from any location with an internet connection. These systems also typically provide real-time updates and data syncing, so everyone can access the most current information without the need for manual updates or delays. Another benefit: Cloud-based solutions don’t require heavy up-front technology investments.
Enhance Your Procurement Insights With NetSuite
NetSuite Procurement equips businesses with the tools they need to simplify purchasing and gain better visibility into every aspect of the process. Its real-time dashboards deliver instant insights into spending, supplier performance and PO status, giving decision-makers the power to respond swiftly and make data-driven choices that boost efficiency and reduce errors.
Fully integrated into NetSuite’s cloud-based ERP system, the NetSuite Procurement module connects seamlessly with finance, inventory and supply chain functions. This keeps data flowing smoothly among departments, breaking down silos and enabling smarter decisions in real time. NetSuite’s 100% cloud-based infrastructure adds flexibility, giving teams access from anywhere without the burden of complex IT maintenance. And with automatic updates, the system remains scalable and up to date, easily adapting to growing needs.
When all is said and done, procurement dashboards don’t just streamline processes; they empower businesses to turn data into action. By providing real-time insights and control, dashboards can redefine procurement as a strategic driver of efficiency and growth, rather than as a behind-the-scenes afterthought.
Procurement Dashboard FAQs
What is procurement in simple terms?
Procurement is the process of acquiring goods or services that a business needs to operate. It involves finding the right suppliers, negotiating prices and managing contracts. The goal is to secure high-quality products at the best possible price while maintaining strong supplier relationships. Procurement is essential for keeping a company’s operations running smoothly and cost-effectively.
What is an example of procurement?
Imagine a retail company purchasing inventory from suppliers. The procurement team identifies vendors, negotiates prices for bulk orders and places purchase orders for the necessary products. It also manages contracts and tracks delivery to ensure that goods arrive on time and meet quality standards. This process helps the business maintain stock levels while controlling costs.
What do procurement departments do?
Procurement departments source and acquire the goods or services a company needs to function. They manage supplier relationships, negotiate contracts and make sure purchases meet quality and budget requirements. They also track deliveries, oversee inventory levels and handle any issues that arise with suppliers. Their goal is to optimize purchasing processes and keep costs down to facilitate smooth operations.