Inventory usage is a measure of how quickly inventory is being drawn down. As a metric, it’s both common and valuable because it’s easy to calculate and can be used to improve and protect business operations in a variety of ways. As with most inventory metrics, though, it relies on accurate data and reliable data storage and processing.
What Is Inventory Usage?
Inventory usage is a snapshot of how much a business’s stock has declined over a specific period. By following inventory usage, businesses can track the number of units, not their dollar value, making it different from the inventory metrics commonly found on accounting statements. By understanding inventory usage, businesses can make better decisions about how much inventory to order and when. They will also be able to tell which products are selling well or poorly, which can help with longer-term planning. In some cases, tracking inventory usage can even help businesses identify problems with storage, supply chains, employee training, or security.
Key Takeaways
- Inventory usage is a comprehensive measure of how much inventory gets used over a specified time period.
- Unlike many metrics, inventory usage is measured in units of inventory, not by their dollar value.
- Inventory usage is different from consumption or sales figures in that it also considers other ways inventory draws down, such as through donations, theft, damage, and spoilage.
Inventory Usage Explained
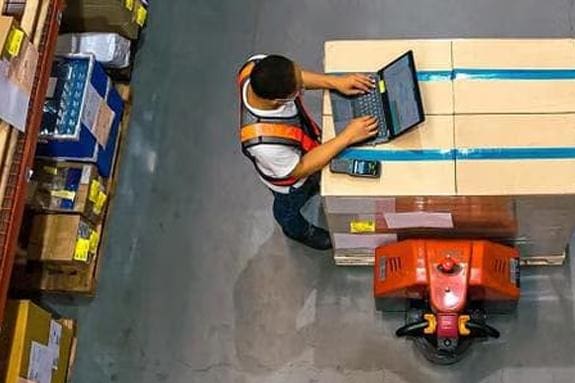
A business might have inventory to sell, such as items on a shelf in a store, or inventory for internal use, such as surgical masks used by a hospital’s staff or chips that go into an electronics manufacturer’s devices. In either case, it’s important for a business to know how much inventory it has and how quickly it has been drawing down its stock. Inventory usage is a direct measure of how much inventory has gone from “in stock” to “not in stock” over a specified time. Note that this is not the same as how much was sold or how much was used for its intended purpose. Inventory levels can be drawn down for other reasons, such as theft, expiration, or damage. The inventory usage calculation takes all of that into account, and it does so in terms of actual units (as opposed to dollar value, which can fluctuate for reasons unrelated to inventory). This is what makes inventory usage a unique, useful, and easy-to-understand calculation.
Importance of Calculating Inventory Usage
The all-encompassing approach of inventory usage is precisely why it’s important to have a dedicated measure of this number, like sales, or an estimate. In a perfect world, a business’s inventory usage of glass vases would be the same as the number of units sold. But if these fragile items are shattered now and then during handling and shipment, that’s (a) an important factor affecting inventory levels and (b) good to know as soon as possible so the business can take steps to correct it, such as placing larger orders for vases to make up for the damaged ones.
In fact, looking at discrepancies between inventory usage and related metrics can be an excellent diagnostic practice. Is on-shelf inventory decreasing too fast to be explained by sales? Is the company not using enough cleaning supplies or personal protective equipment, indicating that employees may not be taking proper safety precautions?
On a day-to-day basis, inventory usage gives companies an idea of what’s happening to their supply of products essential to the business, which is important for informing routine management decisions, such as deciding the timing and size of reorders, for example. And, every once in a while, inventory usage can alert the organization to a major problem.
Inventory Usage Calculation Methods
Calculating inventory usage requires a decision first: For what period do you want to calculate it? A business might want to know its inventory usage for a fiscal year, a quarter, a month, a busy weekend, or even over a lunch rush.
Two things should be true about the chosen time period:
-
You have access to the data that makes it possible to track what you want to monitor. For example, businesses that measure inventory levels at the end of each week can’t calculate inventory usage over the course of one Tuesday.
-
The time period in question is meaningful. Maybe the business measures lots of metrics monthly or quarterly, so calculating inventory usage over the same time span allows it to get a more complete picture of its operations. Maybe you want to know how things progressed during a particular period when business was unusually good or bad. Maybe you want to know if breakage goes up during the first month after hiring a group of new employees. It could be anything, as long as it’s meaningful to the business.
Basic Formula
Once you’ve selected the time period, the rest is easy. The formula is:
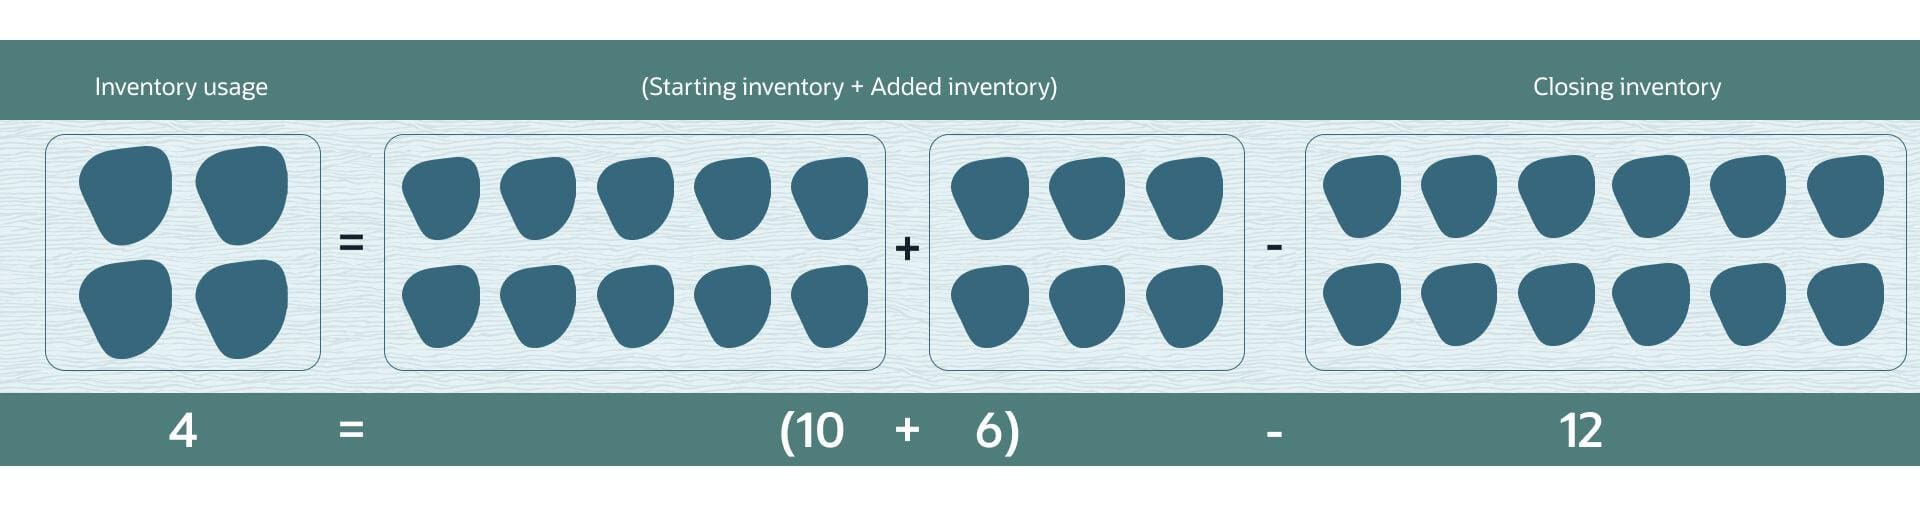
Inventory usage = (Starting inventory + Added inventory) – Closing inventory
All variables in this formula should be in units of inventory, not dollars. Starting inventory is the inventory level at the beginning of the chosen time period; closing inventory is the level at the end of the period; and added inventory is how many units were added during the period. Some versions of this formula will use “purchases” instead of “added inventory” because that’s the most common way inventory increases, but there are other ways. If you’re calculating inventory usage for a nonprofit, for example, there may be donated items. If the business resells returned items, that would be another way inventory could increase without purchasing new stock.
To understand the value of this formula, first think of a world in which no inventory gets added. If you start with 10 widgets and end the period with six, then your inventory usage would be four widgets (10 – 6 = 4). Maybe you sold or used all four, but the way inventory drew down doesn’t matter for this calculation. If you sold two, gave away one, and accidentally broke one, your inventory usage was still four units.
Now, let’s introduce additions. Say you start with 10 widgets, use four, but buy six more during that period. The closing inventory level would be 10 minus 4, plus 6, or 12 units. Putting that into the formula, inventory usage would be (10 + 6) – 12 = 4 units. The reason additions need to be included is because you want to know every unit that left inventory, which is not the same as the net change in inventory.
The Inventory Usage Formula
Periodic vs. Perpetual Inventory Systems
Businesses that use software to help manage their inventory may have to decide between using periodic or perpetual methods for valuing and managing inventory, though leading systems will support perpetual inventory management, which offers a number of advantages. A periodic approach involves physical counts at specified intervals, which could then be plugged into the formula above to calculate inventory usage. However, this approach can quickly become problematic and unreliable as businesses grow. A perpetual system should capture any changes to inventory levels in real time and could keep a running total of every time inventory went down for any reason over a period, making it easy to track inventory usage.
Even with a perpetual inventory system, it’s a best practice to periodically check inventory levels via inventory counts to make sure the system is capturing everything properly. For example, while the software might record all of a company’s sales, the records may not include an employee breaking something or stealing a unit from the warehouse. In that case, an inventory usage calculation based only on the perpetual system’s data may present a result that is lower than the actual level.
Tools for Calculating Inventory Usage
While the formula is simple, there are several ways to implement routine calculations of inventory usage. As businesses grow and become more complex or sophisticated, they could find themselves quickly moving down this list:
-
Manual calculation: If the business is simple and inventory usage doesn’t need to be calculated often for many different time periods, using spreadsheets or a similarly basic tool is a reasonable choice because the math is basic and can be easily automated. As a business grows and understandably becomes more complex, however, manual calculations will become less reliable because keeping spreadsheets updated and connected to the right data becomes burdensome and prone to human error. This is why it’s not an approach to rely on over the long run.
-
Inventory management software: A dedicated inventory management system will keep track of a business’s inventory and perform many relevant calculations while also monitoring and helping managers analyze the results of those calculations. Given that most businesses with substantial inventory will need an inventory management system anyway, it makes sense to also use the system to perform inventory usage calculations. A good software package helps business managers see a more complete picture with accurate, up-to-date data on their stock—and it does so automatically. That means business managers can spend less time on performing, organizing, and compiling calculations, and more time on thinking through implications and what steps business should take in response.
-
Integration with ERP and point-of-sale (POS) software: A full ERP system will include inventory management as one of many interoperable software modules. This provides all the benefits of inventory management software plus the extra benefits that come from better integration with a full range of other business processes, such as manufacturing, supply chain management, warehouse management, finance, and accounting. Bringing together finance and accounting functions with inventory makes all kinds of analysis and reporting easier, faster, and more reliable. It also saves time when tracing a problem to its root cause, since you don’t have to worry about translating data between systems and making sure those systems are all up to date and present the information in the same way.
For businesses that run their own physical stores, integrating POS software can help even further. Imagine how easy it becomes to calculate inventory usage for virtually any period if the system knows when every unit was sold, to the minute, and every time any location reports a change or updated inventory level. This is a small example of the power that comes from having well-integrated systems across your business.
Common Mistakes in Inventory Usage Calculation and Strategies to Avoid Them
Calculating inventory usage isn’t complex, but there are still some common pitfalls to watch out for. A real-world implementation of inventory metrics is never as simple as it is in a classroom (or in an article), but knowing where things can go wrong is often enough to prevent them from doing so.
-
Overlooking inventory shrinkage: In a perfect world, there would never be shrinkage. A company buys inventory, uses and/or sells inventory, buys more, and the cycle repeats. But there’s a reason we calculate inventory usage separately from sales, and it’s because there are other ways inventory levels can decrease. Theft, damage, and expiration are all unfortunate inevitabilities for many businesses. Though much can be done to minimize those factors, eliminating them entirely isn’t realistic. When calculating inventory usage, it’s important to take into account all the ways an item can leave inventory. This doesn’t apply only to bad sources of inventory drawdown. Some businesses, for example, donate inventory when appropriate, which is another non-sale way of reducing stock.
-
Inaccurate data-entry practices: Inventory usage is a calculation with only three inputs, but the result depends on those three inputs being accurate. Like all models, no matter how simple or sophisticated, bad inputs yield untrustworthy results. Make sure, before you rely on this calculation (or any other), that you know how the data has been compiled and have confidence in that process or system. Doing regular checks on things such as inventory assessments and data-entry practices can help catch errors early while increasing organization-wide confidence in the numbers.
-
Neglecting timely record updates: This is an issue specific to manual data entry. If data is old, it’s no longer relevant, and that situation can lead to missteps in response to the data and other issues. While it’s the result of not regularly updating information rather than entering the wrong data, the principle is the same: If the inputs are bad, the results won’t be usable.
-
Disregarding seasonal variations: This tip is less about how the calculation can be wrong and more about how it might steer you wrong. If a business calculates inventory usage quarterly, it could get perfectly accurate results that mislead it about what to expect the next quarter. For example, an ice cream business would know that sales are much stronger in the summer. But last summer the company was much smaller, so the amount of ice cream it needs for the coming busy season might be higher than any season previously recorded. A better approach for predicting the coming summer’s inventory needs would be to determine how much inventory usage grew year over year for the two most recent quarters and apply that multiple to last summer’s usage data.
Sometimes, for longer- or shorter-term analyses, seasonal variation might mean you don’t even want to look at “seasons” at all. If a business is producing a forecast for the next fiscal year, analyzing inventory usage for the past several full years may be fine. But if its plan needs to have monthly detail, looking at data averaged over an entire year would obscure the important month-to-month variations. This is why picking the right time windows is critically important and makes the difference between a calculation that’s inaccurate and one that’s both accurate and useful.
-
Incorrect unit measurements: Remember that inventory usage is measured in units of inventory and that those units should be consistent. Companies using inventory management software probably have some inventory metrics measured in dollars for accounting purposes. That isn’t directly comparable or useful for inventory usage calculations. A business may also change how it sells goods in a way that requires some inventory counting adjustment. For example, if a company switches to selling variety packs of three scented candles instead of one candle at a time, it must make sure that it doesn’t mistakenly count the sale of one lavender candle as the same inventory drawdown as a sale of a three-pack containing lavender, vanilla, and chamomile candles. Pick a unit that makes sense for the item(s) in question, and be consistent.
-
Failing to track returns: If returned items can be resold, they need to be included in inventory usage calculations. For example, if a retailer starts the month with 100 wind chimes, buys 50 and ends the period with 70, the formula would tell you that inventory usage was (100 + 50) – 70, or 80 units. If none were damaged or stolen, you might think you sold 80 units. But if 10 wind chimes from the previous month were returned and put back on the shelf, you actually added 60 units to inventory—and 90 were sold that month.
-
Insufficient documentation procedures: When everything is working smoothly, documenting every update to your inventory can feel unnecessary. But when something goes wrong, or someone has a question, or the numbers drift away from reality, leaders will want answers—and quickly. Documenting what you’re doing creates an auditable trail that can be used to identify the source of issues. But more than that, sometimes the act of documenting what’s happening is what enables employees to catch a mistake as it’s happening or before it happens. The specifics of what does and doesn’t need to be documented will vary from business to business, but anything you’ll want data on things go wrong is something you’ll only have access to if you’re diligent about its documentation.
How Different Industries Utilize Inventory Usage Calculations
Inventory usage is a metric used across the entire economy, in virtually every sector that deals with physical inventory. Here are a few examples of how different industries find inventory usage a valuable metric.
-
Food and beverage: Inventory usage can diverge from sales in large and unpredictable ways for restaurants and other food and beverage companies. Many of their inventory inputs expire quickly, and there’s a tendency to overstock in an effort to make sure the business can always produce what customers want. Food that has to be discarded because it didn’t sell before expiration can be a huge part of a business’s inventory usage, and tracking that granularly (day to day or, for some businesses, even hour to hour) helps provide insights that can have a major impact on profitability. This applies to other industries that sell perishable physical goods as well, such as florists, but food and beverage is where it’s most common and often most critical.
-
Retail: This is another area where sales figures alone don’t provide sufficiently accurate data for managing inventory and estimating how quickly it is being drawn down. Many retailers deal with theft and breakage, and even when that’s rare, different promotions and changes in stock-keeping units (SKUs) can make it difficult to keep everything straight. Inventory usage can be valuable when managing a store, especially one that’s busy or has a lot of different kinds of inventory.
-
Manufacturing: For manufacturers, calculating inventory usage is especially useful for tracking inputs. A factory needs to make sure it has enough of all the inputs that go into its products, and those inputs may not always be consumed in predictable ways. If a factory needs a coolant to run its machines, for example, its usage could depend not just on production volume but also on factors including continuous uptime and even the weather. And when dealing with inputs rather than finished goods, sales data metrics can’t help you figure out where the inventory is going.
-
Healthcare: In healthcare, running out of inventory could literally cost someone their life, but it’s not reasonable to have a limitless amount of everything on hand all the time. So healthcare providers must track a great deal of critical inventory—think pills, medical kits, and masks and disinfectant needed to protect employees—and other inventory most people wouldn’t even think of, such as fuel for emergency generators to keep life-support systems running during a storm. Keeping track of how quickly a healthcare system is using inventory can be essential for providers that need to be ready for anything today, while remaining financially sustainable so they can be there for patients in the future.
-
Technology: Technology companies that manage stock often embrace software and are likely to use inventory management systems and ERP platforms. But technology companies also have unique challenges. Similar to food and beverage, technology components and products also “expire,” in a sense, when they become obsolete and have little to no value. But unlike food and beverage, a technology company doesn’t always know when that will happen. A large company with very loyal fans might be able to tell (Apple, for example, controls when the next iPhone will launch, making prior versions less valuable), but most technology companies don’t have the same luxury. Perhaps calculating inventory usage wouldn’t have saved a digital camera maker from a sudden drop in sales when smartphone cameras became competitive with their products, but staying on top of inventory usage can provide an early warning when things start to change. In highly innovative, fast-moving sectors, every little bit of advance warning helps.
-
Hospitality: For hospitality businesses that don’t fall under the “food and beverage” umbrella, it often doesn’t make sense to calculate inventory usage for their primary product. A hotel, for example, considers room nights as inventory, but that element resets every night, the same way seats on an airplane refresh for every flight, no matter how many were filled or not filled on the previous flight. For hospitality businesses, therefore, inventory usage typically comes into play when tracking the physical inventory that supports their primary product. For example, hotels often have restaurants and retail shops in the lobby. And they also have cleaning supplies, plastic keycards, branded pens, paper covers with ruffled edges that go over in-room glassware, and much more. Just because a customer isn’t explicitly buying the pen and glass cover, doesn’t mean those aren’t part of the nightly room rate.
Optimize Your Inventory Usage With NetSuite Inventory Management
When thinking about how to calculate and analyze inventory usage for your own business, finding tools that help prevent common pitfalls including inaccurate data entry and out-of-date data not only saves time but also positions your business to get the most benefit from inventory usage analytics in a timely manner. NetSuite Inventory Management directly addresses both the challenges and the opportunities presented by analyzing inventory usage metrics.
With its real-time tracking, automated calculations, and seamless integration with other business processes, NetSuite Inventory Management helps businesses maintain accurate inventory data, minimize errors, and make better-informed decisions. Plus, NetSuite’s ability to handle more complex inventory scenarios, including multilocation management, returns, and donations, helps companies make inventory usage calculations that are precise and actionable. Furthermore, NetSuite’s customizable reporting and analytics tools help businesses gain deeper insights into their inventory usage patterns, seasonal variations, and potential shrinkage issues. By using NetSuite’s comprehensive ERP solution, companies across various industries can optimize their inventory management practices, reduce costs and improve cash flow—all of which contributes to their overall operational efficiency and profitability.
Inventory usage is a simple calculation that measures how quickly a business’s items are being used up, whether they are sold, broken, stolen, donated, or used by employees in the course of doing business. It can be an important bellwether metric for changes, opportunities, and problems. Monitoring inventory usage over useful time periods (be they weeks, months, or years) can give managers critical information to keep the business profitable and catch problems early.
Inventory Usage FAQs
What are the four types of inventories?
Inventory can generally be categorized into one of four types:
- Raw materials, which are inputs used in a company’s production process.
- Finished goods, referring to products that are ready for sale.
- Works in progress are partially completed items, somewhere in between the previous two types.
- Maintenance, repair, and operations (MRO) includes supplies used to run a business but not intended to be sold to customers.
What is the average daily usage inventory?
Average daily usage is a measure of how much inventory usage is happening, on average, every day. It’s calculated by evaluating inventory usage over a period longer than a day and dividing that inventory usage by the number of days in the calculation period.
How to calculate inventory usage?
Inventory usage for a period is calculated by noting the initial inventory at the beginning of the period (in units), adding the number of units that were added to inventory over that period, and subtracting the final inventory level at the close of the period. So, if a company started with 10 widgets, bought four, and ended the period with eight, inventory usage for that period would be six widgets: (10 + 4) – 8 = 6.