
Healthcare organizations face significant challenges when delivering high-quality care to patients, not the least of which is navigating financial, operational, clinical, and regulatory demands. Without a clear understanding of their company’s strengths and weaknesses, healthcare leaders can struggle to adapt to the evolving needs of their patients and the broader healthcare landscape. To make the targeted and effective operational improvements needed to overcome these challenges, decision-makers need to take a data-driven approach to monitoring and assessing their business. This article explores 35 essential key performance indicators (KPIs) that provide valuable insights into improving efficiency, as well as patient experiences and outcomes.
What Are Healthcare KPIs?
Healthcare KPIs are quantifiable measures used to evaluate a healthcare business’s performance, metrics to gain insights into facility operations and analyze specific strategic and operational goals. By tracking healthcare KPIs over time, decision-makers can monitor and analyze trends to identify successes and areas for improvement, ultimately enhancing business operations as well as the quality of patient care.
Healthcare KPIs encompass a wide range of metrics, such as profit margins, patient wait times, and readmission and infection rates. They’re often organized into distinct categories—including financial performance, operational efficiency, clinical quality, and patient experiences—that give healthcare professionals a more comprehensive view of overall strength and performance over time, while maintaining the option to zoom in for a more granular analysis. By setting targets for each KPI and regularly checking on progress, companies can ensure that they’re meeting their goals and making necessary strategic and operational adjustments as results come in.
Key Takeaways
- KPIs are specific data points that businesses use to assess their performance over time.
- In healthcare, monitoring and analyzing KPIs helps businesses improve patient outcomes and internal operations.
- Healthcare organizations do best when they track a balanced mix of financial, operational, and clinical KPIs to gain a comprehensive view of their performance.
- By regularly updating KPIs, companies can stay competitive and adapt to the evolving demands of the industry, as well as to the needs of their patients and communities.
Why Is Measuring Healthcare Efficiency Important?
According to U.S. Center for Disease Control and Prevention data, 88% of office-based physicians are using electronic health records. But healthcare providers also track and analyze many KPIs to help them create data-driven strategies for improving patient care in deliberate and targeted ways. For example, say a clinic sets a goal of shortening the duration of an average patient office visit. To adjust processes and workflows, the clinic can track metrics, such as average number of patients seen daily and average patient wait time. Armed with this information, the clinic can begin to understand the efficiency of its processes when making decisions on resource allocation, quality improvement initiatives, and more. When well-managed, these improvements will lead to better patient outcomes, increased patient satisfaction, and reduced operational costs.
Beyond achieving improved patient care, healthcare companies that prioritize increased efficiency are generally better positioned to succeed than their competitors, even if market conditions change. By demonstrating an ongoing commitment to KPI analysis, healthcare providers can attract more patients, secure funding from investors or government agencies, and establish themselves as top providers in their fields. And in an era when health services expenditures have risen 152% over the last 20 years, according to St. Louis Fed data, measuring and improving efficiency is more than a best practice—it’s a necessity for long-term success and sustainability.
How to Develop Meaningful Healthcare KPIs
To develop meaningful healthcare KPIs, businesses must first set specific objectives and determine which metrics directly monitor the processes that will contribute to those targets. This may include listing data categories, such as financial performance, operational efficiency, clinical outcomes, and patient satisfaction. Once the broad categories have been identified, businesses can define specific, measurable, achievable, relevant, and time-bound goals for each KPI—collectively known as SMART KPIs. These goals are typically founded on a combination of industry benchmarks, historical performance data, and the organization’s own improvement targets.
To ensure that the selected KPIs are comprehensive, key stakeholders from across the company should be involved in approving them, including clinicians, administrators, finance professionals, and patient representatives. This diverse range of perspectives helps companies create a list of relevant KPIs that paint a wide but carefully painted picture of operational performance. Additionally, stakeholders should regularly review and adjust KPIs as needed to make sure they remain relevant over time. This updating process should involve revising goals, modifying metrics, and adding/deleting KPIs to reflect changes in the business’s priorities or the healthcare industry as a whole.
How Can Healthcare Dashboards Enhance Reporting?
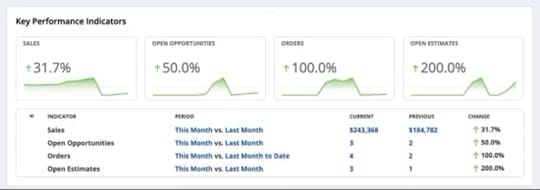
Healthcare dashboards are digital tools that consolidate data from various sources into a single, user-friendly interface. Dashboards provide accurate and real-time insights into a company’s performance across multiple departments, allowing healthcare leaders to track, analyze, and report on multiple KPIs from one location. This centralized view helps to quickly identify trends and spot anomalies using current and historical data, rather than delayed or incomplete reporting.
Dashboard metrics and visualizations can be customized to meet the specific needs of different stakeholders within a healthcare organization. Executive-level dashboards, for example, often focus on high-level financial and strategic metrics, while department-specific dashboards drill down to more granular operational and/or clinical data. This tailored approach allows teams to access the most relevant and actionable information for their roles, which fosters better collaboration and accountability for staff at all levels. Moreover, these dashboards are often part of a larger, cloud-based business platform, such as an enterprise resource planning system, that authorized users can access from anywhere, empowering teams to stay coordinated, even when they’re working from different areas or facilities.
35 Healthcare KPIs to Monitor
Healthcare organizations rely on a diverse set of KPIs to monitor performance, and the ones they choose and how they categorize them ultimately depends on the insights they hope to glean. Following is a list of 35 key healthcare KPIs sorted into three main categories—financial, operational, and clinical and patient-centric—as well as relevant formulas and what the KPIs reveal about a business’s operations. It’s important to note that many of these KPIs can exist in different contexts and may be better suited for other categorical placement, depending on the particulars of the healthcare organization using them.
Financial KPIs
Financial KPIs provide insights into various aspects of a company’s financial performance, including revenue generation, cost management, wage costs, accounts receivable turnover, and more. In the healthcare industry, financial KPIs also include specific revenue-focused insurance metrics, such as payer mix, claim denials, and processing times. Here are some important financial KPIs for healthcare organizations to consider.
1. Total Revenue Generated
Total revenue generated is the sum of all income earned by a healthcare organization over a specific financial period, typically a fiscal quarter or year. This KPI helps organizations track their overall financial performance and growth over time to see the impact of revenue growth strategies.
Total revenue generated = Sum of all income from each revenue source
2. Total Expenses
On the other side of the financial equation are total expenses, which is the sum of all costs incurred by a healthcare company during a financial period. These include operating expenses, such as salaries, supplies, and overhead costs, as well as any non-operating expenses, including interest and settlement payments. Monitoring total expenses helps organizations control costs, assess budget accuracy, forecast future expenses, and maintain profitability.
Total expenses = Operating expenses + Non-operating expenses
3. Net Profit Margin
Net profit, also called the bottom line, is the revenue left over after accounting for all expenses, including taxes and interest; because of its comprehensive, all-in nature, net profit is often used as a signifier of a company’s overall financial health. Net profit margin turns this figure into a percentage of revenue, helping healthcare organizations gain an apples-to-apples comparison of overall profitability over time.
Net profit margin = (Net income / Total revenue) x 100
4. Operating Profit Margin
Operating profit margin calculates the percentage of revenue that remains after subtracting the cost of goods sold and any operating expenses, such as administrative salaries and office supplies, from total revenue. This remaining profit is commonly called operating income, or operating profit, and is typically found on the income statement, one of the major financial statements, along with gross and net income. Operating profit margin focuses on the profitability of a healthcare organization’s core operations, rather than on the entirety of its finances.
Operating profit margin = (Operating income / Total revenue) x 100
5. Operating Cash Flow
In healthcare, operating cash flow is the cash generated by a company’s primary operations: providing services to patients. Cash flow is distinct from profit and revenue, because services may have been performed and revenue earned, but if cash hasn’t yet changed hands, the company can’t spend it on immediate obligations, such as supply orders or wages. This is especially important in healthcare, where insurance claims and patient payment plans can cause a significant delay between performed services and receipt of payments.
Operating cash flow = Cash revenue – Operating expenses paid in cash
6. Payer Mix
Payer mix shows the proportion of revenue that comes from different sources, including Medicare, Medicaid, private insurance, and self-pay patients, all of which reimburse at different rates. This KPI helps healthcare organizations track their revenue sources and their financial vulnerability to any changes in payer policies. By understanding payer mix, healthcare financial teams can fully grasp the distinctions among all types of payer, including their reimbursement rates and payment schedules, to mitigate risk and ensure a diverse payer mix.
Payer mix = (Revenue from each payer source / Total revenue) x 100
7. Average Cost per Treatment
Average cost per treatment covers all the expenses associated with a specific treatment or procedure, including direct costs, such as supplies and labor, and indirect costs, such as overhead and administrative expenses. Providers can use this KPI to confirm the efficiency and profitability of individual services by comparing the average cost per treatment to reimbursement rates.
Average cost per treatment = Total cost of providing treatment / Number of treatments provided
8. Average Cost per Discharge
Average cost per discharge tracks the cost of treating patients from the time they’re admitted until they’re released, and it includes all services, supplies, and overhead expenses. Because of the wide range of costs and outcomes, this KPI helps healthcare organizations gain an understanding of the overall efficiency and cost-effectiveness of their inpatient care, which in turn informs resource allocation and identifies areas for streamlining costs during patient stays.
Average cost per discharge = Total inpatient costs / Number of discharges
9. Reimbursement Rate
Reimbursement rate is a ratio that compares billed charges to what the company actually receives from payers. A low reimbursement rate may signify an ineffective billing and collections process, high costs for services that may be losing revenue, or a misalignment with industry-standard rates. A high reimbursement rate typically signifies better revenue capture and more competitive spending practices.
Reimbursement rate = (Total reimbursement / Total billed charges) x 100
10. Claims Denial Rate
Calculating the claims denial rate lets healthcare companies track the percentage of their submitted insurance claims that are denied by payers. A high claims denial rate can indicate issues with coding, documentation, or eligibility verification, any of which can contribute to unpaid services and revenue loss. By monitoring this KPI over time, medical billers can check the effectiveness of their processes and track the impact of new billing practices.
Claims denial rate = (Number of denied claims / Total claims submitted) x 100
11. Average Insurance Claim Processing Time and Cost
This KPI measures the time and expenses associated with processing and collecting payment for an average insurance claim. Healthcare organizations can use this metric to assess their revenue-cycle management process and compare results against historical data or industry benchmarks. By reducing claim processing times and costs, organizations can improve cash flow and minimize the likelihood of delayed, rejected, or overlooked payments.
Average insurance claim processing time (or cost) = Total time (or cost) to process claims / Number of claims
12. Accounts Receivable (AR) Turnover
Accounts receivable (AR) turnover measures how often a company collects its average AR balance over a given period, typically a year. This metric helps businesses determine how efficient they are at collecting payments from insurance companies and patients. Generally, higher AR turnover ratios indicate more effective billing, collections, and payer contracts.
AR turnover = Net credit sales / Average accounts receivable balance
13. Permanent Employee Wage Cost
Permanent employee wage cost includes all salaries and wages for full-time employees, calculated as a percentage of revenue. This metric allows decision-makers to review their staffing models and improve labor allocation. By monitoring this KPI over time and comparing it to industry benchmarks, healthcare companies can budget their labor costs, while keeping wages competitive and sustainable.
Permanent employee wage cost = (Total permanent employee wages / Total revenue) x 100
14. Referral Volume
Referral volume counts patient referrals from external providers or sources over a specific period—a critical way for healthcare companies to increase their patient base and, with it, revenue. This KPI lets organizations measure their market share, reputation, marketing strategies, and relationships with referring providers. Companies can also break down referral volume by source, specialty, or service line to identify both referral successes and fields where prioritizing marketing or networking pushes might increase revenue.
Instead of a formula, providers calculate referral volume simply by counting the total number of referrals received over a given time frame, sorted into their chosen categories.
15. Virtual Visit
With the rise of telehealth and online appointments, virtual visits have become commonplace for many healthcare companies. These visits come with their own unique financial requirements, from technological infrastructure investments to expanded access for patients physically unable to come into the office. By tracking the percentage of virtual visits, providers can better understand their patients’ needs and preferences, and project expected staffing and reimbursement rates accordingly. For example, if a primary care practice notices a high virtual visit rate for routine follow-up appointments, it may consider expanding its telemedicine offerings to include specialty services or consultations.
Virtual visit rate = (Number of virtual visits / Total number of visits) x 100
Operational KPIs
As the name implies, operational KPIs focus on a company’s day-to-day operations. In healthcare, these KPIs guide providers in allocating resources and improving workflows through data-driven decisions and strategies to ensure high-quality patient care. By monitoring data points, such as bed occupancy, equipment usage, staffing metrics, and team communication, healthcare companies can track their efficiency and productivity. Here are some of the most important operational KPIs for healthcare organizations to measure.
16. Medical Equipment Utilization
Medical equipment utilization measures the amount of time that a specific piece of equipment, such as an MRI machine or CT scanner, is in use during operating hours, thereby allowing healthcare organizations to assess the efficiency of their equipment usage, identify opportunities to optimize capacity, and make informed decisions about equipment purchases, maintenance, and scheduling. For example, if a medical company has a high usage rate for its MRI machines but not its X-ray machines, it may be more efficient to replace one or two X-ray devices with an additional MRI machine to reduce patient wait times.
Medical equipment utilization = (Total hours equipment is used / Total available operating hours) x 100
17. Bed Turnover Rate
Bed turnover rate monitors the number of patients admitted to hospital beds over a specific period, typically a month or a year, to show healthcare companies how well they manage their bed occupancies and to elucidate wait time reduction strategies that ease patient flow. Bed turnover rate is typically best used within a larger context, alongside KPIs such as readmission rates and patient satisfaction, to give a more comprehensive view of care. For example, focusing solely on increasing bed turnover can lead to less personalized care and poorer patient outcomes, especially considering that deaths are also considered when calculating newly available beds. On the other hand, a low bed turnover could signify slow care and unnecessarily long patient stays.
Bed turnover rate = Total number of patient discharges or deaths / Total number of beds
18. Bed Occupancy Percentage
Bed occupancy percentage measures the proportion of available hospital beds occupied by patients over a specific period. Healthcare organizations use this KPI to determine demand for inpatient services, which in turn helps them optimize bed capacity during high demand periods. Tracking this KPI over time also lets decision-makers assess the impact of bed management strategies on underutilization and allocation. For example, if the maternity ward is consistently at or near 100% occupancy but a nearby wing is mostly empty, expanding the number of available beds in the former may enhance patient outcomes and patient wait times.
Bed occupancy percentage = (Total number of occupied beds / Total number of beds) x 100
19. Operating Room Utilization
Operating room utilization measures how much time an operating room is in use during available operating hours. This KPI is similar to machine equipment utilization, as it helps healthcare organizations examine how effectively they’re performing their surgical services. By comparing operating room capacity with actual use, companies can make data-driven decisions about staffing, scheduling, and resource allocation for surgical procedures.
Operating room utilization = (Total hours operating room is used / Total available operating hours) x 100
20. Staff-to-Patient Ratio
Staff-to-patient ratio assesses available healthcare staff, such as nurses and physicians, relative to the number of current patients. Staffing teams and schedulers use this KPI to determine necessary staffing levels and ensure that patients receive safe, timely, and high-quality care. The ideal staff-to-patient ratio varies among healthcare organizations, based on the type of care provided and the urgency of the services. For example, a private general practitioner’s office may require a lower staff-to-patient ratio compared with an intensive care unit, where patients need more frequent and immediate attention.
Staff-to-patient ratio = Total number of healthcare staff / Total number of patients
21. Average Staff Turnover Rate
This KPI measures how often staff leave the organization over a given period to demonstrate the stability of a healthcare company’s workforce. If turnover is increasing, companies should identify contributing factors, such as overworked employees or poor working conditions, to develop targeted retention strategies. High staff turnover can lead to greater recruitment and training costs, as well as lost institutional knowledge and a decrease in the quality of patient care.
Average staff turnover rate = (Number of staff departures / Average number of staff) x 100
22. Average Number of Patients Seen During Operational Hours
This KPI tracks how many patients a healthcare facility serves, on average, during regular business hours, helping organizations study their patient flow processes and optimize staffing levels, scheduling, and resource allocation. The average can be calculated hourly, daily, monthly, or by any other chosen unit of time. By monitoring this metric over time, healthcare providers can identify peak demand periods so they can ensure adequate staff coverage, minimized patient wait times, and a better patient experience, without having to overspend on labor.
Average number of patients seen = Total number of patients served / Number of operating days (or other unit of time)
23. Communication Efficiency Among Care Teams
In the healthcare industry, patients often work with multiple care teams, including primary care, radiology, surgery, and physical therapy. These teams need to efficiently communicate to exchange timely and relevant information about patient services and status. Open communication lets medical providers maintain continuity of care and minimize errors. Providers can customize the types of communication they include in this KPI, from document handoffs to multidisciplinary team meetings, ultimately leading to more standardized and effective communication protocols.
Communication efficiency = (Number of successful communication instances / Total number of communication attempts) x 100
24. Regulatory Compliance Rate
Companies can use the regulatory compliance rate KPI to assess how well they adhere to applicable laws, regulations, and standards, an especially important metric for the heavily regulated healthcare industry. These regulations govern patient safety, data privacy, documentation, and billing practices, but specific medical fields often have their own additional rules for businesses to follow. Maintaining a high regulatory compliance rate helps companies avoid penalties, maintain reimbursement eligibility, and build patient trust.
Regulatory compliance rate = [(Total instances – Noncompliant instances) / Total instances] x 100
Clinical and Patient-Centric KPIs
Clinical and patient-centric KPIs are linked because they focus on care quality and the overall patient experience. These metrics help healthcare organizations measure how effectively they’re delivering safe and patient-centered care, while also finding places where they can improve the patient experience. Metrics, such as clinical outcomes, patient satisfaction, and others, help providers ensure that they’re meeting the needs and expectations of their patients without wasting resources. Below are some important clinical and patient-centric KPIs.
25. Patient Satisfaction Index
The patient satisfaction index measures patients’ sentiments about their healthcare experience, typically through surveys or questionnaires, to give healthcare companies a glimpse into their patients’ perspective and whether they feel satisfied, neglected, or frustrated. When calculating this KPI, some companies simply find the percentage of patients that report a positive experience. However, more detailed patient satisfaction surveys ask questions about wait times, staff friendliness, communication, and the perceived effectiveness of treatment and care. To calculate this more comprehensive patient satisfaction index, healthcare providers use a weighted average of survey responses, with higher scores indicating greater satisfaction. For example, a hospital that prides itself on staff availability and expertise may assign a higher weight to patient communication scores compared to other factors, such as wait times.
Patient satisfaction index = Sum of each survey category’s score x weight / Total number of responses
26. HCAHPS Survey Completion
The Hospital Consumer Assessment of Healthcare Providers and Systems (HCAHPS) survey is a standardized questionnaire hospitals use to measure patient experiences. Hospitals are required to have patients complete this survey to receive full reimbursement from the Centers for Medicare and Medicaid Services. The HCAHPS survey completion rate tracks the percentage of patients who complete the survey and provide valuable feedback on care quality and patient satisfaction. A higher completion rate indicates a more representative sample of patient experiences, allowing healthcare organizations to more accurately understand and report how their patients feel.
HCAHPS survey completion rate = (Number of completed surveys / Total number of eligible patients) x 100
27. Readmission Rate
The readmission rate measures the percentage of patients who return to the hospital within a specific time frame (usually 30 days) after discharge. A high rate may indicate issues with care quality, discharge planning, or post-discharge follow-up. Providers often track these rates through automated medical record analytics and can improve them by prioritizing care coordination, patient education, and transitional care services. Reducing the readmission rate can also lower costs, which can be considerable. According to a study published in the National Library of Medicine in March 2024, the mean cost of a 30-day readmission for a U.S. hospital is $16,037.08. However, it’s important to regard this KPI in context, as external events, such as a public health crisis or widespread illness outbreak, can bring people back to the hospital regardless of care quality.
Readmission rate = (Number of readmitted patients within chosen unit of time / Total number of discharged patients) x 100
28. Average Patient Wait Time
Average patient wait time measures the time elapsed between patient check-in and the start of their appointment or procedure. Long wait times can negatively affect patient satisfaction, and may indicate scheduling and staffing inefficiencies or bottlenecks in patient flow processes, such as overly complex check-in procedures or slow room turnover. By evaluating this KPI before and after implementing changes, healthcare companies can better identify where and why these slowdowns occur to reduce wait times and improve the patient experience.
Average patient wait time = Total wait time for all patients / Total number of patients
29. Emergency Room Visit Rate
The emergency room (ER) visit rate measures the number of ER visits as a percentage of a set number of patients in a specific population or service area, typically 1,000. A high ER visit rate may indicate issues with access to preventive care, care coordination, or management of chronic conditions, as well as the overall health of the population the provider serves. By monitoring this KPI and identifying trends, healthcare companies can develop targeted interventions and community outreach programs to reduce unnecessary ER visits and improve the general population’s health.
ER visit rate = (Number of ER visits / Total population) x 1,000
30. Appointment Cancellation Rate
When patients cancel appointments, it often leads to lost revenue, reduced productivity, and frustrating scheduling issues, especially when reschedules create longer wait times. The appointment cancellation rate KPI measures these patient cancellations as a percentage, helping healthcare organizations identify patterns and develop strategies to reduce them. Some common strategies include investing in more robust appointment reminder systems, offering more flexible scheduling options, and addressing common reasons for cancellations with patients, such as transportation issues or holiday hours.
Appointment cancellation rate = (Number of canceled appointments / Total number of scheduled appointments) x 100
31. No-Show Appointment Rate
Like cancellations, no-show appointments can impact revenue, productivity, and wait times. By tracking patients who don’t show up for appointments without prior notice and communicating with them, healthcare providers can identify the situations that contribute to no-shows, such as ineffective customer relationship management software, long wait times, confusing scheduling processes, or patient dissatisfaction. With this data in hand, decision-makers can implement targeted strategies to reduce no-shows, including improved patient outreach, incentives for keeping appointments, and a specified no-show policy.
No-show appointment rate = (Number of no-show appointments / Total number of scheduled appointments) x 100
32. Follow-Up Visit Rate
The follow-up visit rate measures the percentage of patients who attend a follow-up appointment within a specified time frame after their initial visit or procedure. This KPI helps healthcare organizations evaluate their ability to offer comprehensive patient care, which can reduce readmissions and complications. A high follow-up visit rate may point to strong patient-provider relationships and a proactive approach. To increase this rate, providers must communicate with patients about the importance of follow-up visits. Many patients who “feel fine” may not understand the value of care continuity, especially when managing chronic conditions.
Follow-up visit rate = (Number of patients who attended a follow-up visit / Total number of patients scheduled for a follow-up visit) x 100
33. Complication Rate
Healthcare providers should monitor how many patients experience adverse events or complications related to their medical treatment or procedure. The complication rate KPI tracks the safety and quality of care provided to help analysts identify health trends and spotlight areas where care standards may be slipping. Organizations can calculate this KPI broadly, over the population, or for specific procedures/illnesses to develop targeted strategies to reduce complications. A high complication rate may indicate shortcomings with staff training, equipment maintenance, or patient education/follow-through.
Complication rate = (Number of patients who experienced complications / Total number of patients treated) x 100
34. Medication Error Frequency
Medication errors stem from inaccurate prescriptions or administrative practices, and they can potentially harm patients and their health outcomes. Therefore, all medication must be carefully inventoried, dispensed, and administered to avoid adverse drug effects and prolonged hospital stays, as well as to maintain patient safety standards and the provider’s reputation. The medication error frequency KPI tracks these errors per a specified number of medication orders or patient encounters, often 1,000.
Medication error frequency = (Number of medication errors / Total number of medication orders or patient encounters) x 1,000
35. Infection Control Effectiveness
This KPI measures a provider’s ability to prevent and control infections by tracking healthcare-associated infections (HAIs) per 1,000 patient days or procedures. Effective infection control requires comprehensive sterilization procedures for which the U.S. Centers for Disease Control and Prevention offers these three guidelines for increasing performance:
- Regularly monitor disinfectant and sterilization guidelines for endoscopes and train staff on these guidelines.
- Develop a reporting mechanism for occupational health events and implement future exposure plans.
- Monitor instruments for possible sterilization failures and recalls.
Infection control effectiveness = (Number of HAIs / Total number of patient days or procedures) x 1,000
Monitor Healthcare KPIs With NetSuite
Gaining useful insights from KPIs requires healthcare providers to capture and analyze large datasets quickly and accurately. With NetSuite’s comprehensive healthcare software solution, companies can track, analyze, and learn from KPIs applicable to various aspects of their operations through user-friendly and customizable dashboards. NetSuite’s integrated platform empowers healthcare providers to manage financial, operational, and clinical data in a single, centralized system, giving users real-time visibility into critical metrics, such as accounting, patient relationship management, and compliance. This increased visibility allows decision-makers to identify trends, benchmark performance, and make data-driven operational improvements.
NetSuite’s healthcare-specific features, such as HIPAA-attested compliance tools and internal controls, allow businesses to easily monitor and view relevant and secure data, gaining actionable insights at a glance. The solution’s financial management tools help healthcare organizations streamline accounting processes to optimize revenue cycle management and reporting, while ensuring compliance with industry regulations.
By carefully selecting a combination of financial, operational, and clinical KPIs, healthcare professionals can gain a comprehensive view of performance throughout their organization. This data-driven approach gives leaders the ability to identify strengths and weaknesses, set ambitious but achievable goals, make informed decisions that improve patient outcomes, and create a more efficient and streamlined operation. And, as the healthcare industry evolves—and patient requirements evolve with it—ongoing KPI analyses and adjustments will allow businesses to stay ahead of their competition and continue to deliver high-quality care.
Healthcare KPIs FAQs
What is the difference between OKRs and KPIs in healthcare?
OKRs (objectives and key results) define high-level objectives and how a business will monitor progress. KPIs (key performance indicators), on the other hand, are the specific metrics healthcare companies use to measure performance over time. In other words, OKRs provide a strategic framework for setting goals, while KPIs are the tactical metrics used to measure progress toward those goals.
What are metrics in healthcare?
Metrics in healthcare are quantifiable measures used to track and assess various aspects of healthcare performance, such as bed turnover rates, total expenses, and average patient wait time. These metrics tend to be tailored to a business’s specific needs, goals, and priorities that fall into categories, such as operational efficiency, financial strength, and patient outcomes.
What are leading indicators in healthcare?
Leading indicators are metrics that predict future performance outcomes. In healthcare, some common leading indicators include patient health outcomes to predict readmittance rates, employee satisfaction rates to inform turnover expectations, and the adoption of new technologies that are expected to improve outcomes and operational efficiency.