
Key performance indicators (KPIs) are important metrics that track a company’s progress toward achieving its strategic and operational goals. Monitoring KPIs over time helps organizations make better, data-driven decisions. Rewarding employees and teams for progress on KPIs that are aligned with company objectives can create a virtuous cycle that sets a company up for success.
This guide to KPIs provides comprehensive information about the different types of KPIs, how to choose them, and how to use them. Whether you’re a C-suite executive or line-of-business manager, a customer-facing employee or working in the back office, there’s much to learn.
What Are Key Performance Indicators (KPIs)?
A KPI is a quantifiable measurement that shows how a company, department, or initiative is progressing toward specific performance goals. KPIs translate activities, such as inventory management or financial performance, into clear, actionable metrics that management can monitor over time.
Businesses track a wide range of KPIs. High-level indicators (e.g., revenue growth or net profit margin) reveal overall business health, while functional metrics focus on areas like sales, marketing, human resources, or manufacturing. The most useful KPIs are typically tied directly to explicit objectives and deliver targeted insights, ranging from broad measures such as gross profit margin and employee turnover rate to custom metrics for specific challenges, such as average call center pick-up rate.
Key Takeaways
- KPIs are quantifiable measurements that gauge a company’s performance toward its goals.
- KPIs can be created at the strategic and operational organizational level, as well as for specific teams, projects, and individuals.
- Best practices for selecting KPIs include alignment with business goals, active monitoring, and accurate reporting and timelines.
- Automation of KPI reports and dashboards keeps all stakeholders aligned.
Key Performance Indicators (KPIs) Explained
KPIs let businesses establish objective targets, thresholds, and timeframes for success. Each KPI has four parts: the metric to track, its target outcome, the data source, and the cadence of measurement. By monitoring KPIs over time, companies can spot trends, seize opportunities, and surface trouble spots before they escalate.
A well-designed KPI should also place performance in context against industry standards, historical baselines, or competitor data. This focus helps teams gauge progress within the broader competitive landscape. For example, a manufacturer aiming for efficiency might track units produced per hour and compare its results against its equipment’s rated capacity, while a software company chasing growth might analyze customer acquisition cost and lifetime value against rival benchmarks.
What Is the Difference Between a KPI and a Metric?
Companies capture a lot of data that they convert into metrics, but only some of those metrics qualify as KPIs. Metrics simply record how business activities and processes perform, while KPIs are the curated subset of those metrics that link directly to the company’s strategic priorities.
For example, the total square footage of retail space can be a useful metric when planning a new store. Combine it with monthly sales figures and it becomes a KPI that measures how effectively the space generates revenue, “monthly sales per square foot.” Similarly, website page views are a common marketing metric, but the KPI “conversion rate” ties marketing effort to sales and profit.
Understanding this distinction helps companies choose measurements that drive improvement rather than overloading decision-makers with irrelevant data.
Why Are KPIs Important for Businesses?
KPIs are important management tools. They provide focus and clarity and guide behavior, productivity, and decision-making. KPIs also offer transparency and accountability. The way a company communicates its KPIs across the organization conveys its mission and values and sets the tone for the work environment.
Therefore, it’s essential to select appropriate KPIs that align with the company’s goals. While a KPI can provide a useful snapshot at a specific point in time, KPIs are even more powerful when used to analyze progress over longer periods. Their value expands further when businesses consider them in combination with other meaningful KPIs in a dashboard, creating a more complete view of a company’s core operations.
How Are KPIs Used?
KPIs are used to track progress toward a business goal. In practice, KPIs are created, communicated, and then tracked over a period that coincides with the underlying objective.
Organizations typically analyze KPIs at intervals to determine whether course corrections are needed. They may reevaluate their choice of KPIs during this process. Some KPIs may be discontinued, revised, or renewed once a goal has been reached. KPIs are often used for employee recognition, development, and financial rewards.
Benefits of Measuring with KPIs
Measuring with KPIs does more than track performance; it gives decision-makers concrete evidence of how changes affect operational efficiency and resource allocation. Furthermore, monitoring the same KPIs across different departments enables apples-to-apples comparisons that can be used to better align companywide operations.
In greater detail, KPI measurement does the following:
- Detects potential issues and anomalies: KPIs act as an early warning system by highlighting unusual patterns or deviations from expectations. When a KPI moves outside its normal range, managers can investigate root causes before minor issues escalate. Dashboards can be used to issue automated alerts whenever values fall outside of set thresholds.
- Informs and reinforces decisions: KPIs replace gut instinct and personal bias with objective, quantifiable data. These data points validate successful strategies and spotlight ineffective ones, creating a feedback loop that reinforces wins and signals when a new approach is needed.
- Defines business success: Businesses can use KPIs to set measurable targets for every initiative, removing ambiguity about what constitutes success. They also create a common language for discussing performance across departments and management levels, reducing misunderstandings.
- Promotes ownership and accountability: Assigning specific KPIs to teams or individuals establishes clear expectations for performance reviews. When employees can see how their work moves the numbers, they may be more likely to take greater ownership of results, engage more deeply in improvement efforts, and better understand how their performance measures up to expectations.
- Aligns cross-division strategy: Tracking shared KPIs helps different teams coordinate around common objectives. With interconnected KPIs in view, leaders can encourage collaboration, preventing conflicting priorities and counterproductive internal competition.
Types of Key Performance Indicators (KPIs)
While there are many KPIs to choose from, most can be grouped into broad categories based on their purpose. One common method for categorizing KPIs is the “balanced scorecard” framework of perspectives, which includes:
- Customer perspective or outcome focus: KPIs that focus on customer interactions and their views on product quality and performance. They may include customer satisfaction, acquisition and retention, brand awareness indexes, or average handle time within a call center.
- Financial perspective: KPIs that examine profitability, liquidity, risk, and financial efficiency. Days sales outstanding (DSO) and current ratio are examples.
- Growth perspective: KPIs that measure returns on investment in equipment, research, and staff to achieve the desired medium- and long-term growth. Return on marketing investment and customer acquisition cost are examples.
- Process perspective: KPIs that focus on the efficiency of specific processes. These can be units produced per hour in a manufacturing plant or billable hours in a professional services company.
Many industries commonly measure human resource management (HRM) KPIs. They typically measure employees’ output and work efficiency. Examples include closed sales per salesperson and accounts payable processing cost per invoice. Other HRM KPIs measure absenteeism, turnover, and recruiting time.
Lastly, some KPIs can be project-specific. These typically measure progress toward milestones, dates, or key deliverables.
Leading and Lagging KPIs
When analyzing KPIs in any category, it’s important to consider whether they are a leading or lagging indicator. These filters provide context that can influence decision-making, especially regarding timing issues.
- Leading KPIs are predictive, pointing to possible future events or outcomes. They are useful for planning purposes. Take, for example, a sudden increase in the number of returned products. This might signal an issue with quality or expectations that were poorly communicated—and indicate that revenue will be lower going forward.
- Lagging KPIs measure what has already happened. They highlight patterns or trends over time. By monitoring those trends, companies can determine if they need to rework their plans. For example, if the KPI for inventory turnover has been decreasing over the past three quarters, the company may want to put a new go-to-market plan in place to reverse the trend.
It’s a best practice to consider a combination of leading and lagging KPIs for the same goal. Lagging indicators are more easily and accurately calculated, but are backward-looking. Leading indicators are often subject to interpretation but can provide time to change course if accurately interpreted.
Organizational and Operational KPIs
Another way to categorize KPIs is based on whether they are organizational or operational in nature. These categories are mutually exclusive but require precise alignment.
- Organizational KPIs measure strategic, long-term goals that are tied to a company’s mission or values. Examples include market share gains, customer acquisition increases, global expansion, and revenue growth. Companies sometimes focus on a single all-important metric during each phase of a product’s life cycle, an approach known as one metric that matters (OMTM).
- Operational KPIs monitor day-to-day business performance in terms of tactical, operational processes and efficiency. Operational KPIs can be applied to processes, teams, and individuals. Examples include sales by region and cost per click for a digital marketing campaign.
How Many KPIs Do You Need?
There is no right answer to this question, though conventional wisdom suggests “less is more.” A selective approach helps keep the team focused on clear goals. Different teams will have unique KPIs aligned to their group’s goals. Most KPI dashboards display three to five KPIs for a given functional area, such as accounts payable KPIs.
When choosing KPIs to use for a particular goal, it’s helpful to have a mix of leading and lagging KPIs. Keep in mind that too many organizational KPIs can signal strategy confusion, and too many operational KPIs can spread effort thinly across competing targets.
What Makes a Good KPI?
Good KPIs deliver the most value for a company’s industry, size, needs, priorities, and goals. For example, a business built on long-lasting customer relationships will likely track customer-facing KPIs such as retention and churn rates, while an organization that relies on institutional expertise may focus on employee turnover and engagement scores. Designing KPIs with focused attributes tied to clear goals—and revisiting them regularly—keeps performance analysis relevant as needs change.
The five categories below are good starting points for using the right KPIs.
SMART KPIs
A common way to selecting KPIs is the SMART framework, which stands for specific, measurable, attainable, relevant, and time-bound. Here’s how it applies to a customer-retention KPI that tracks repeat purchases:
- Specific: Focuses on a single area, in this case customer retention.
- Measurable: Quantified by data (e.g., the percentage of customers who make a second purchase within 60 days).
- Attainable: Sets a realistic target based on available resources and past performance, such as boosting customer retention percentage by 15%.
- Relevant: Aligns with business priorities. In this case, the company wants to increase repeat business and lifetime value.
- Time-bound: Evaluated within a defined window, say over the next two quarters.
Clearly Communicated
A clearly communicated KPI is one that every stakeholder, from frontline employees to executives, can understand and act on. This means spelling out:
- What is being measured.
- How the KPI is calculated and how often it’s updated.
- Why it matters to the business,
- Where to see the number (dashboards or other visualizations that show current performance against targets).
Regular KPI review meetings reinforce this shared understanding and surface knowledge gaps that, if left unaddressed, can snowball into missed targets and misaligned strategies.
Aligned With Business Objectives
Every KPI should connect to an explicit goal or target, not just a static data point. This link helps keep resources devoted to meaningful outcomes rather than simply optimizing a number with no larger impact on performance. When narrowing down KPIs, leaders should draw clear lines between each metric and the overall strategy. Increasing first-time website visits, for example, directly supports a company’s plan to reach new customer segments, especially when tracked alongside conversion rates and sales data. Connections like this help employees understand why improving these KPIs matters.
Proportionate
A proportionate set of KPIs gives a full view of performance without overwhelming teams with needless tracking requirements. Some departments may only need a handful of KPIs to gain meaningful insights into their workflows, while more complex operations may require more. For example, a small sales team might monitor three or four KPIs related to outreach and closed deals, whereas a factory floor manager may track multiple output and efficiency KPIs at each workstation to spot bottlenecks quickly. Whatever the exact mix, the goal is to cover all critical details without distracting staff from productive work.
Simple
Simple KPIs avoid elaborate formulas or scattered data sources that can create more hassle than insight. They make it easier for stakeholders to grasp findings, leading to faster, more informed, and data-driven decisions. For instance, replacing a complex customer satisfaction metric with a simple 1–5 rating can increase response rates and lead to faster adjustments when issues surface. Simplicity also boosts buy-in across teams, reduces miscalculations, and yields more consistent interpretations of results. This doesn't mean KPIs should strip away essential detail—only that companies should KPIs as straightforward as the decision at hand allows.
KPI Best Practices
It can be challenging to select and manage the right KPIs for a business, and choosing incorrectly can be costly. Following industry standards can ease this risk somewhat, as can adherence to a few KPI best practices. These best KPI practices include:
- Aligning KPIs closely with the goals they are measuring.
- Measuring the KPI in a specific, consistent, and accurate way.
- Setting a KPI that’s attainable in a reasonably finite period of time.
- Choosing clear, relevant KPIs that encourage the right actions to achieve the goal.
- Challenging and re-evaluating the usefulness of the KPI for the purpose intended.
How to Create KPIs in 5 Steps
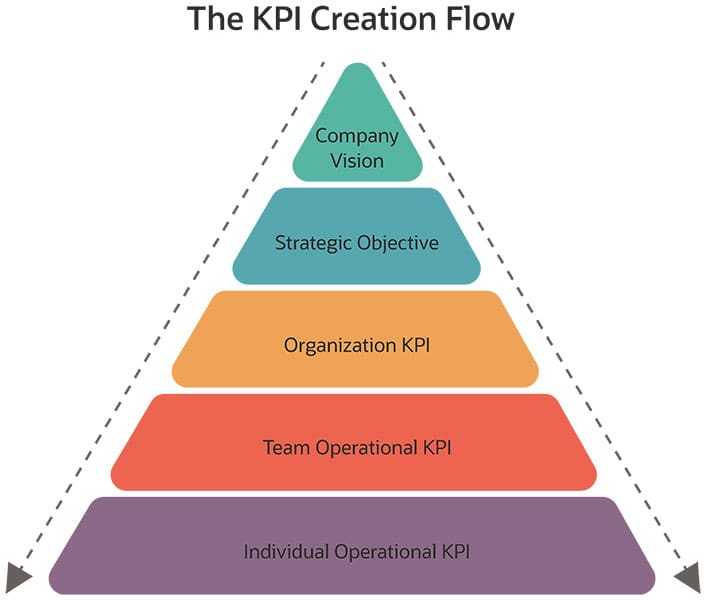
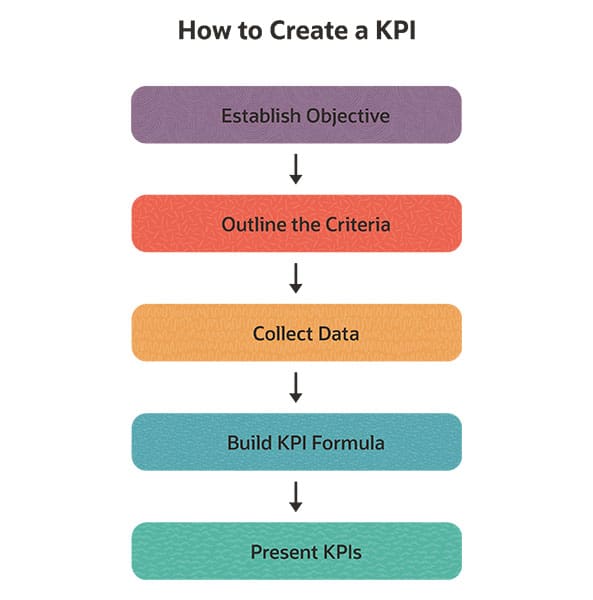
When creating KPIs, it’s important to “keep your eyes on the prize,” i.e. the specific goals you are aiming to achieve. Avoid mission creep and don’t go overboard. KPIs naturally flow out of an organization’s vision and cascade through all levels in the organization, ultimately creating individual KPIs for each employee. Follow these five steps for creating KPIs:
- Establish an objective: Clearly define the strategic objective or operational goal the KPI will measure.
- Outline the criteria: Identify the data that will be used for the KPI and confirm its integrity. Outline objective sources of information.
- Collect data: Establish how data will be collected and how often it will be updated.
- Build a KPI formula: Ideally, the KPI formula should be easy to understand and applied consistently.
- Present KPIs: Determine how to communicate and visually present the KPIs in dashboards or other tools. This should be done in a way that achieves buy-in from all stakeholders, especially those whose actions are critical to achieving the objective.
KPI Examples
Organizations have hundreds of KPIs at their disposal, falling into categories includes sales, operational, and HR. Selecting the right ones depends on the goal being measured, the industry, and the company. Typical examples of KPIs include:
-
Sales KPIs
- Sales target: Compares new wins to targets or other periods.
- Sell-through rate: The percentage of available inventory sold during a given period.
- Sales conversion time: How long it takes for the sales team to convert the average lead into a sale.
-
Financial KPIs
- Days sales outstanding (DSO): The average amount of time it takes to collect cash from sales made on credit.
- Gross profit margin: The percentage of revenue retained after deducting the direct costs of producing a product or delivering a service.
- Current ratio: Compares a company’s current assets to its current liabilities to measure its ability to meet short-term debts.
-
Customer KPIs
- Customer lifetime value: How much revenue a company makes from each customer over the course of the business relationship.
- Customer churn rate: The percentage of active customers who stop purchasing in a set period of time.
- Call center pick-up rate: The percentage of customer calls that are answered within the first minute they are received.
- Customer retention rate: The percentage of existing customers who continue doing business with a company over a specific period.
-
Operational KPIs
- Defective unit rate: Compares the number of defective units manufactured to the total number of units manufactured.
- Perfect order rate: A ratio of the number of error-free orders compared to the total number of orders processed.
-
Marketing KPIs
- Incremental sales: Looks at additional revenue generated by marketing initiatives over baseline sales to determine the effectiveness of marketing campaigns.
- First-visit metric: Tracks how many first-time visitors come to a company’s website and their level of engagement during their first visit.
- Return on marketing investment (ROMI): Measures how much additional revenue a marketing campaign generates compared to its cost.
-
HR KPIs
- Employee turnover rate: Calculates the fraction of employees who leave an organization during a specific period.
- Time to hire: Measures the average recruitment cycle length, or the number of days between posting a job opening and filling the position.
- Employee engagement score: An index from employee-survey responses that gauges commitment, motivation, and alignment with company values.
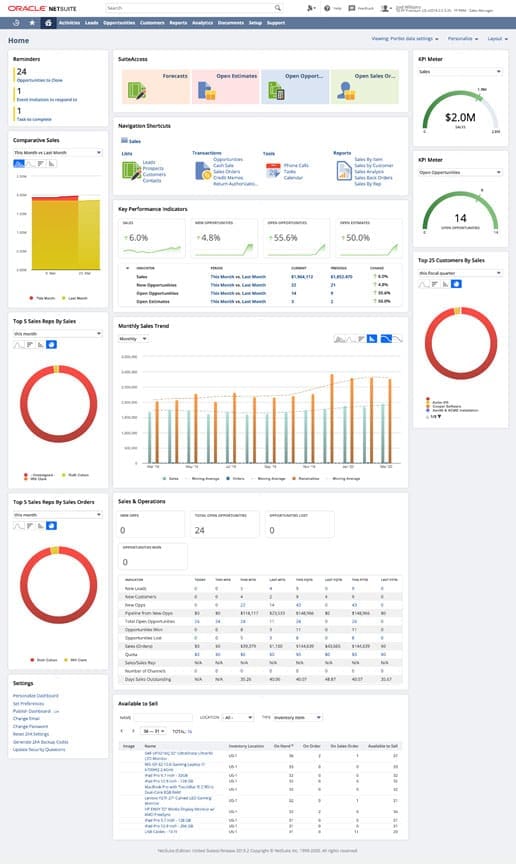
KPI Reporting and KPI Dashboards
KPIs should be monitored on a regular basis, using the most current information available. Automated reports and dashboards can replace the need for time-consuming manual processes.
- KPI reports: Recurring reports should include KPIs to facilitate continual analysis. Many software offerings let businesses customize reports, run them automatically at specified intervals, and send them to key stakeholders.
- KPI dashboards: Graphic interfaces that display KPIs and other important information, are populated with real-time data. Customization is key here, too. Dashboards can be customized for specific roles, like a CFO dashboard, departments, or the organization as a whole.
NetSuite’s KPI Dashboard
Free KPI Template
This free downloadable spreadsheet template takes you through each step of the KPI development process using the example of days sales outstanding, a typical accounts receivable KPI. The process begins with establishing objectives and source data. The template also includes an example formula and KPI graphic presentation.
Download the template(opens in a new tab)
to start building out and tracking your KPIs today.
Tracking KPIs With an ERP System
KPIs signal whether a company is on track to achieve its business goals, but companies that try to build and monitor KPIs manually often find the additional work very labor-intensive. This work can overshadow the analysis and decision-making part of the process. Further, reporting lag time can impair the company’s ability to act in a timely way.
A more effective approach to KPI management is via automation and integration with a company’s enterprise resource planning (ERP) system that stores all the information the organization would need to calculate any metric. ERP with built-in analytics that present data, charts, and KPIs in dashboards and reports provide quick access to real-time, actionable KPIs.
KPIs provide an objective way to measure progress toward a company’s goals. They can be set at the strategic or organizational level and aligned with operational KPIs for teams and individuals. They help create a culture of accountability and data-driven decision-making. Integration with an ERP system can make KPI creation and tracking processes more efficient.
KPI FAQs
What is a KPI in simple terms?
A KPI, or key performance indicator, measures how successful a company is in meeting its targets, objectives, or industry benchmarks.
What are the five key performance indicators?
Companies have numerous KPIs at their disposal. The ones they choose depend on their goals and operational processes. Some KPIs are used by a wide variety of companies in different industries, like operating and net profit margin, sales growth, and accounts receivable turnover. Companies also choose industry-specific KPIs. For example, manufacturers may track KPIs that measure how quickly and efficiently they convert their investments in fixed assets and inventory into cash.
What are some examples of KPIs?
Organizational KPIs measure strategic goals, like global expansion. Operational KPIs track day-to-day business activities. Examples of organizational KPIs are revenue growth or the cost and rate of customer acquisition. Examples of operational KPIs include days sales outstanding and defective unit rate.
What is a KPI and why is it important?
A KPI measures a company’s progress toward a set of objectives. Tracked over a set period of time, KPIs help an organization make better, data-driven decisions. They also can guide behavior, productivity, and decision-making, and provide transparency and accountability.