Operational reporting offers leaders insights for specific time intervals, usually focusing on the short-term. Stakeholders use the reports to support the rationale for rapid decision-making. This article covers the types of operational reports, examples and best practices for using them.
Inside this article:
- Benefits of operational reporting
- The two main systems of operational reporting
- The four types of operational reports
- How business intelligence tools are on the rise
What Is Operational Reporting?
Operational reporting refers to the process of providing detailed insights into a company’s daily operations. Often called day-to-day performance tracking, these reports typically include visuals to present workflow data, enabling leaders to make swift, informed decisions.
Basic operational reporting offers standardized reports with limited customization. Advanced reporting, on the other hand, automates data collection, allows for custom report creation, and integrates data from multiple sources for comprehensive analysis.
Key Takeaways:
- Operational reports in a visual format featuring a dashboard with drill-down data help leaders make fast, informed decisions about daily operations.
- Regardless of industry, the goal of an operational report is to improve efficiencies and save money.
- Operational reporting supports analytics in real-time as well as delivering on monthly or bigger picture data.
Examples of Operational Reporting
Operating reporting examples vary by industry. People in finance use an operational report to focus on data needed for a client. A sales executive would use the filters in a dashboard to see specific data. A marketing group uses it to see if an ad campaign is effective.
The top three major industries that can optimize their business by using operational reports include:
-
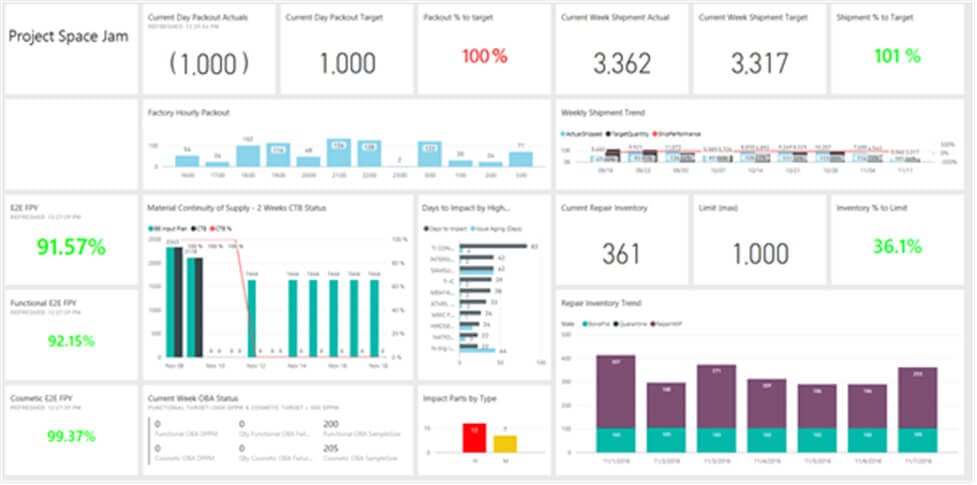
Manufacturing: Operational reporting is critical in the manufacturing industry for many reasons. The goal is to measure vital parts of its production chain to improve machine downtimes and operational costs. Operational reporting is also useful for monitoring the complete production line, measuring individual employee efficiency, and analyzing defect rates.
An operational report could include data on resource usage and costs, production efficiency, and even how different machinery is performing.
Manufacturers monitor operations to avoid costly problems in the supply chain and production line. Leaders can make quick and accurate decisions by connecting details like shipping, machine usage, and factory production flow.
- Shipment status
- Packout
- Inventory
- Shipment trends
- Equipment

Example of a Manufacturing Operational Report -
Retail: Leaders in the retail industry use operational reporting to identify market and product trends while strategizing the product line. Retailers can use insights to manage the supply chain efficiently, optimize productivity, address customer satisfaction and improve sales.
Stores can use data in operational reports to monitor the sales growth against benchmarks and analyze individual sales per shift, calls made, sales numbers and converted leads. The reports are also a good tool for recognizing loyal customers and identifying the most lucrative customer segment.
Retailers can look at data related to how they position goods on the floor or seasonality items by tracking sales data and other metrics daily.
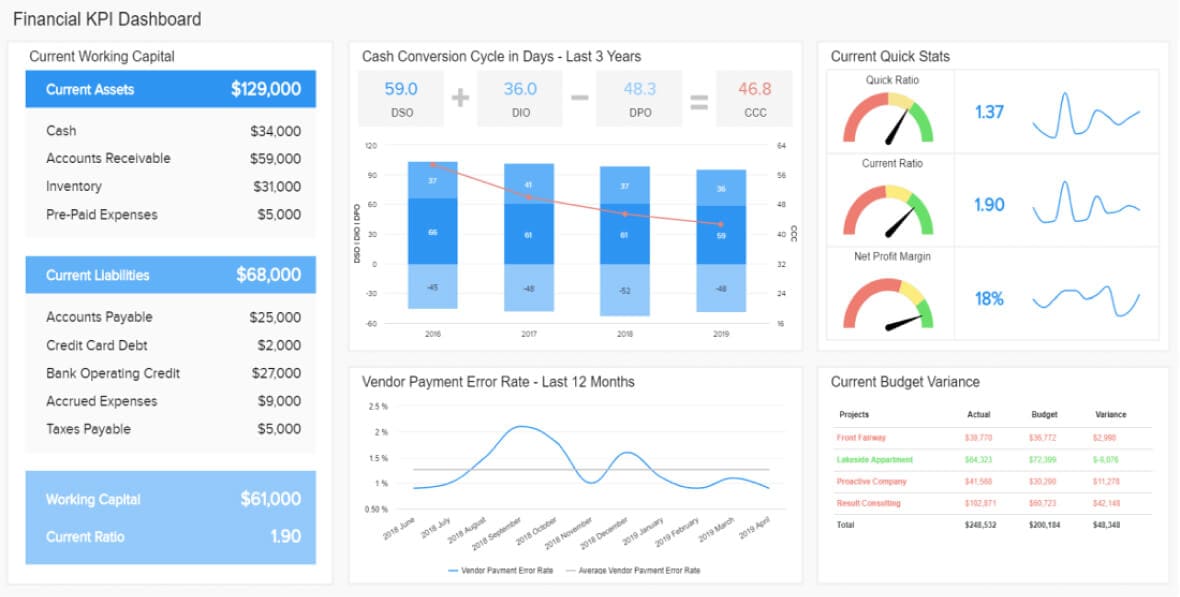
Business intelligence charts and tables integrate data into an easy-to-read dashboard. Leaders can process the information and share it with stakeholders. Customize factors like vendor payment, current financial liabilities and working capital depending on business needs.
- Working capital
- Cash conversion cycle in days
- Budget variance
- Vendor payment error rate
- Net profit margin

Example of a Retail Operational Report -
Warehouse: These facilities are responsible for activities such as fulfillment, distribution, or ecommerce processes. Running regular reports for the warehouse is critical for diagnosing the status of inventory and management processes. They can help you identify products that raise inventory holding costs. Operational reports also reveal ways to improve using a warehouse and best practices for the labor force.
There are many types of warehouse reporting you can use to supply data. For example, you can run reports on shipments by customer, history by supplier, inventory on hand and cycle counts. Learn more about transforming the warehouse.
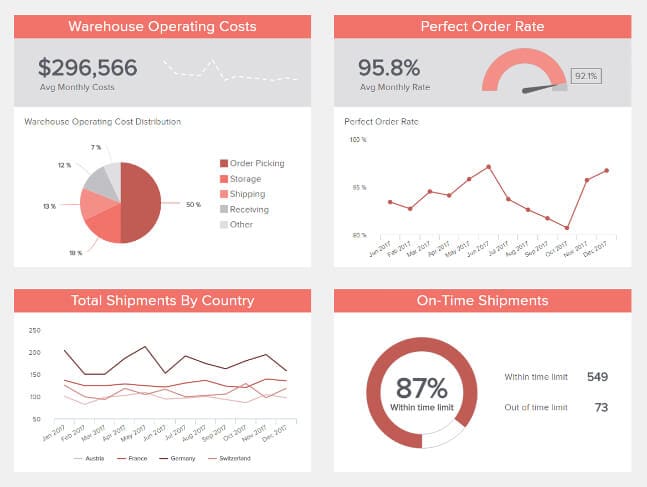
You can use BI tools to simplify the look of data for fulfillment, distribution and ecommerce processes in an operational report. Running reports for a warehouse is critical for diagnosing inventory status. A visual dashboard helps gather, process and present key data findings.
- Warehouse operating costs
- Project order rate
- Total shipments by country
- On-time shipments

Example of a Warehouse Operational Report
When to Use Operational Reporting
When to use operational reporting depends on the needs of the organization. Before you start building reports, identify what you want the reports to tell you.
Organizations in every industry need to stay on top of processes so they can get a complete view of data. Business intelligence tools with visual operations dashboards and filtering options offer ways to download and share real-time or monthly data analytics. An airline might track on-time flights with operational reporting to find trends in delays and ways to improve performance. Major shipping delivery companies like FedEx or UPS use the reports to see if their coordination systems are running efficiently. Those reports would focus on delivery times, delivery volume, customer satisfaction and service coverage.
Why Is Operational Reporting Important?
The data in operational reports is crucial to helping an organization with its business plan. Leaders present data in a report or dashboards and share it internally or externally. This information allows workers and leaders to:
- Make informed decisions in real-time
- Identify ways to save time and money
- Enhance internal infrastructure
- Create long term company initiatives
What Are the Contents of an Operational Report?
The contents of an operational report vary by the type of data and how often you run the reports. They usually contain information about one of these four main types of operational reports:
4 Types of Operational Reporting
- Current information: These reports focus on things that make a facility run. They include data on equipment, such as their current state, parts and warranties. The reports also cover labor and tools in use.
- Current work and planning: This type of operational report is for how work gets done. These usually include data about equipment schedules and employee workload and availability. You'll also find information about parts that are on reserve for upcoming jobs and those that might need restocking.
- Forecasting or predictive analysis: These reports help managers schedule and figure out if there are enough resources available to complete future jobs.
- Historical work and trends: Use this type of operational report to view historical trends about parts, equipment reliability and staff performance.
Depending on which kind of report leaders need, they can drill down on specific information. That might include things like deliverables, costs of resources, production surplus or deficits, employment records, financial structures, organizational processes, and revenue.
What Is Included in an Operational Report?
Operational reports include different data points that take a deep look at organizational processes. Usually, they also have financial reports.
Every operational report has the same goal. Specific data reveals different challenges. The information leaders want varies by industry. Visual dashboards show a snapshot of operations. They can also have filters. For example:
- Financial operational reports include important key performance indicators (KPIs) and metrics along with other relevant details like daily performance.
- Marketing operational reports include data on leads generated, cost-per-click and conversions.
- Operational reports for technology measure response times and quality of tech support.
Reporting is a different challenge when companies move to foreign countries. Executives sometimes use a third party to manage the reports. Many global companies use an integrated cloud-based enterprise resource plan (ERP) to simplify financial reporting and accounting compliance that varies from country to country. Learn more about selecting the right global ERP for your organization.
What Are the Main Systems of Operational Reporting?
There are two main systems of operational reporting: real-time reports and monthly reports. Any high-growth strategy depends on both types of reporting.
- Real-time operational reports: These reports provide live data analytics. Executives can access the reports as needed, focusing on trends, numbers, and statistics as they change in real-time. Filtering results enables managers to strategize in the short term and show them ways to become more responsive and adaptive, with an eye toward improving overall performance.
- Monthly operational reports: Top-level stakeholders use these reports for a holistic view of operations. This data enables them to make decisions based on long-term initiatives. A visual monthly operational report of top-level KPIs helps managers and employees stay on track and revise goals.
It's important to remember is that without correct information on budgets, costs, forecasts, supplies, labor and projects, it's impossible to know what kinds of decisions to make.
What Are the Key Differences Between Functional and Operational Reporting?
Functional reporting and operational reporting differ slightly. While operational reporting looks at the overall function of the day-to-day business, functional reporting looks at the challenges of individual departments. It focuses on the functions and roles within the company.
Functional reporting looks at the operational report to focus on specific tasks. Its goal is to use the skills of the employees within each department effectively.
Let's say an organization's operational reporting shows a performance gap—the company's new goal changes to reducing overall costs. The result of the functional reporting will then vary across departments. Accounting must find how and where to cut costs, for example. Manufacturing, on the other hand, must find ways to increase efficiency in their processes.
What Other Types of Reporting do Businesses Use?
Gathering data is important in every industry. Companies will also use business intelligence (BI) tools and visual dashboards for reporting.
Popular reporting include:
- Analytical reporting: This method uses qualitative and quantitative data to analyze and evaluate a business strategy or process. For example, a hospital report indicates that it can reduce the average waiting time. Or a marketing firm learns that web traffic comes from a source outside of the invested budget. Both can use the information to pivot on their strategy.
-
Strategic reporting: This process sets and meets (or exceeds)
organizational goals on a long-term basis. Usually developed by senior-level management,
these reports focus on high-level metrics. Strategy reporting shows historical, present,
and predictive data, with the goal to:
- Boost employee engagement and innovation
- Improve internal communication and collaboration
- Save time and money through intelligent insight and benchmarking
- Plan for sustainability and optimization in company growth
- Financial reporting: This report uses financial statements to show the economic health of a company over a period. Financial reporting helps management make decisions about the company's future. It supplies information to creditors and investors about the organization's profitability and stability. A basic financial report's format is usually a spreadsheet.
Operational Reporting vs. Business Intelligence
Operational reporting is the process of regularly providing a complete report of a company's activities. Business intelligence, on the other hand, is a smart tool for unifying data.
Operational reports provide insights for time intervals—hourly, daily, weekly and monthly. At times, stakeholders will want to customize these reports and interact with them to drill down or up to find the desired details.
The goal of business intelligence is to gather, process and present data. This process typically uses an interactive dashboard. Working with tools that use BI helps leaders make informed decisions under pressure and in the long term.
Nontechnical employees sometimes build ad hoc operational reports. A user sets up the business intelligence solution and connects it to the data sources. Then they set up parameters and decide which objects the end users can see. After that, they distribute the data.
What Are the Benefits of Operational Reporting?
Business leaders use data from operational reports to track trends. Results from reports are vital for making quick decisions. Operational reporting supports operations management.
Reasons why operational reporting is beneficial to business include the following:
- Operational reporting provides easy-to-understand insights in real-time with visual dashboards.
- Organizational reporting can track progress at all levels of operations.
- Organizational reporting improves efficiencies in various departments.
- Operational reporting shows on-demand analytics to customers. These can be used to present the results of spending and the benefits of buying or investing in a product.
Leaders in operations management use this information to identify patterns and strategize accordingly, while executives can improve their day-to-day work to enhance productivity. The biggest benefit is that organizational reporting helps save time and money.
Operational Reporting Best Practices
Operational reports should be up-to-date and easy to read. Define the target audience and the goal for the report. The business intelligence tool adopted should have a dashboard that is easy to navigate with essential information at the top.
Other best practices to consider:
- Create a data story with a way to filter and sort based on what's important to each user.
- Dashboards should show the top operational key performance indicators (KPIs) at the top and then move to the next level of insights. The last view should show more detailed information for a bigger picture view.
- Employ an automated batch process so reports are consistent. Most operational reports come from a database that use an automated process called a batch process.
- How a user navigates from summary data to the details is the information path. A user should be able to find actionable information within three clicks.
- Users need to understand the origins of data in a report. Add a link that explains the data collection method, filters and formulas.
- Focus a user's attention with a traffic lighting approach—red, orange, and green. Red means stop (or trouble), while green means good.
How Do Businesses Evaluate Operational Reports?
Operational reporting is more common than ever because of recent technological advances. BI systems are also on the rise. And while we know that data-driven reports help leaders make decisions, the reports themselves should undergo evaluations.
The scholarly article "Evaluating the Impact of Operational Reports" reviews current evaluation methods and looks at two factors: qualitative and quantitative.
Qualitative factors included:
- Data quality (reliability, accuracy, and data refresh time)
- Information (relevance and usability)
- Representation (visual effectiveness and accessibility)
Quantitative factors included:
- Time savings (Was there an increase in productivity?)
- Direct impacts (Were there operational changes?)
- Indirect impacts (Were there new compliance to guidelines and/or avoided costs?)
The study reveals that user surveys are the most common types of evaluations. Since surveys are limited in scope, the research shares its own evaluation method, verified with real-world case studies.
Operational Reporting Case Study
ReSource POS, a service and technician provider for point-of-sale systems, wanted to improve its service management processes. As the company added more offices throughout the U.S., it wanted to streamline its service management processes.
The company installed an ERP system that could grow with them. As technicians are at the service call, they enter documentation into their mobile devices, which is more efficient than completing the paperwork after the call. The result is more complete documentation that enables the company to capture revenue accurately. The new system improves the documentation process, dispatcher and technician efficiency and cuts costs.
Learn more about the growing pains of ReSource POS and how ERP made a difference.
Automate Operational Reports With NetSuite
Using business intelligence (BI) and data helps businesses make informed decisions in real-time. NetSuite solutions make operational reporting easy because it provides easy access to all the data you need.
NetSuite financial reporting gives finance and accounting teams powerful tools to analyze and display data. Prebuilt financial reports are customizable to highlight specific results. Combine financial, statistical and operational data with multidimensional analytics to glean new insights into performance.
Use SuiteAnalytics to create saved searches and reports. SuiteAnalytics Workbook offers expanded analytical capabilities for any user who wants to perform data analytics tasks. With NetSuite's SuiteAnalytics, you don't just get reporting—you get a comprehensive view of your business using operational reporting.


