
Intense competition, complex supply chains, changing consumer behaviors, and fluctuating market conditions make it essential for consumer packaged goods (CPG) companies to constantly track and measure their performance, often by individual product. The key performance indicators (KPIs) they choose must produce clear, data-driven insights that can help business leaders make rapid decisions aimed at optimizing operations and maximizing profits.
But the challenges of aggregating and analyzing data across CPG supply chains and distribution networks often result in surface-level or even misleading metrics. This article discusses how to overcome these challenges and reveals the most important KPIs that CPG companies should monitor to achieve sustainable growth.
What Are KPIs?
KPIs are data points that illuminate the health of a business’s operations or some aspect of those operations. Some KPIs report on high-level strategies and goals, while others reflect the performance of specific products, departments, or initiatives.
What Are CPG KPIs?
CPG KPIs are metrics that CPG companies use to measure the performance of their business operations, most notably those that focus on finance, inventory management, and go-to-market strategies. The most important CPG KPIs help companies increase sales, profitability, customer loyalty, and supply chain efficiency.
Total sales and market share metrics, for example, track the money made from selling products and compare the results to similar metrics from competitors. CPG businesses use the information to assess sales performance, evaluate competitive positioning, and produce more accurate forecasts and strategic plans. Additional types of CPG KPIs report on distribution, product availability, expenses, and cash flow.
Most CPG KPIs are strictly quantitative, but some also involve qualitative analysis. Brand awareness and product appeal, for instance, may rely on subjective feedback from shoppers in the form of survey responses or focus group answers. These are also known as intangible KPIs, while quantitative metrics are referred to as tangible KPIs.
Key Takeaways
- KPIs enable CPG companies to make data-driven decisions so they can better identify new opportunities and adapt to changing market conditions.
- Tracking the right KPIs helps enhance CPG inventory management, increase supply chain efficiency, and improve cash flow.
- KPIs can help CPG companies align their teams toward the same goals, such as higher revenue, increased profitability, and greater customer satisfaction.
- Complex supply chains and intricate retailer and distributor agreements make it difficult for CPG companies to accurately track and analyze data in real time. The right systems and tools can help overcome these challenges.
CPG KPIs Explained
CPG KPIs should correspond to business objectives and compare actual performance to predefined benchmarks. If a company’s objective is to increase market share by 5% year over year, and last year it hit 40%, it would set 45% as this year’s benchmark and track its market share KPI against that goal.
Some KPIs rely on one data point to illustrate overall performance. Total sales, for instance, is simply the revenue generated in a specific fiscal period. Other KPIs use ratios, percentages, or comparisons of multiple data points to provide more comprehensive analyses. A common example is market share, which compares one company’s sales of a certain product category to all sales within that category. Customer lifetime value (CLV), return on advertising spend, and other metrics go further by analyzing and reporting on trends over time.
To effectively set KPIs, a company must first define its goals and determine which metrics are most relevant to those goals. For example, if a goal is to increase product penetration in existing markets, then household penetration rate, purchase frequency, and market share would be appropriate metrics. A company should then define success by setting achievable targets for each KPI. It’s crucial to continually monitor these KPIs and update them, as needed.
Why Are CPG KPIs Important?
CPG KPIs help business leaders make decisions based on data, not beliefs, intuition, or assumptions. Businesses use these metrics to identify inefficiencies, capitalize on new opportunities, and refine strategies in light of changing market conditions.
Enterprise resource planning (ERP) systems, business intelligence platforms, and other tools can help automate and simplify KPI monitoring and measurement, allowing companies to implement data-driven strategies. ERP systems, for example, can integrate with data sources from across the organization to provide real-time dashboards that track progress against goals, benchmark performance against industry standards, visualize trends, and automatically update forecasts. CPG-specific analytics platforms offer additional, detailed analyses of industry metrics, such as market share, sales per channel, and trade spend return on investment (ROI). CPG KPIs can also help companies refine inventory management, increase supply chain efficiency, improve cash flow, and maintain regulatory compliance.
Overall, the process of setting goals and identifying the right KPIs to track brings more focus to businesses. And, with this more disciplined approach, CPG companies can devote more resources to the strategies and tactics that drive the most growth.
Types of CPG KPIs
From supply chain logistics to customer engagement, KPIs give CPG businesses a detailed view of their operations. Monitoring the right mix of KPIs can equip companies to fine-tune their strategies and maximize their resources.
Sales Performance
Sales and revenue KPIs make it possible for CPG companies to assess the performance of their products on store shelves, without having to consider costs or other factors. These metrics evaluate:
- Units sold: The number of products sold in a given period.
- Gross sales: Total value of sales in a period.
- Market share: A company’s (or a product’s) percentage of its market’s total sales.
- Order backlog: The value of outstanding purchase orders—a good leading indicator of future sales.
Distribution and Availability
CPG companies use distribution and availability KPIs to confirm that sufficient quantities of product to meet demand are making their way through their distribution networks and onto retailers’ shelves. Some common distribution and availability KPIs are:
- On-shelf availability: The period of time that goods are actually available for purchase.
- Out-of-stock rate: A measurement of the percentage of times a customer was ready to buy a product but couldn’t because it was out of stock.
- Trade spend ROI: The return on funds spent on promotional activities.
- Store-level sales: The number of units of product sold through each store.
Inventory Management
With inventory management KPIs, companies can optimize the amount of stock on hand and better identify when and where those goods are needed. Examples of these KPIs include:
- Inventory turnover ratio: How many times inventory is sold and replaced during a specific period.
- Sell-through rate: The percentage of available products that are sold in a given period—a good measure of inventory efficiency.
- Cash conversion cycle (CCC): Measures the number of days from the time inventory is purchased until the cash from its sale is collected.
- Inventory accuracy: Compares inventory estimates to actual inventory levels.
Customer Engagement
These metrics help CPG businesses track customer sentiment and quantify feedback so they can identify additional opportunities to strengthen relationships and ultimately drive more revenue. Customer engagement KPIs include:
- Net promoter score: Measures how likely customers are to recommend your product or business to others.
- CLV: Estimates the total revenue a customer will generate for your business over their lifetime.
- Customer satisfaction score: Reflects immediate customer satisfaction after interactions with your product, usually collected from surveys.
- Customer retention rate: The percentage of customers who continue buying your product over time.
Profitability
Businesses use profitability metrics to track, analyze, and compare revenue and expenses. CPG companies often rely on these profitability KPIs:
- Net sales: Gross sales minus returns, allowances, and discounts.
- Gross margin: The percentage of revenue remaining after subtracting the cost of goods sold (COGS).
- Operating profit margin: The percentage of revenue remaining after accounting for COGS and operating costs.
- Return on assets: Measures how efficiently the company uses its assets to generate profit.
Benefits of Tracking CPG KPIs
KPIs can help lead CPG business managers to comprehensive insights into their performance. By using the right metrics, CPG companies can identify opportunities to increase profitability, make the supply chain more efficient, enhance cash flow, and gain other competitive advantages. KPIs help direct CPG teams toward the same goals, so they can achieve these benefits:
- Improved decision-making: KPIs identify and quantify trends and can also provide real-time performance snapshots. Businesses can use these data-driven insights to make better informed strategic plans for increasing profitability, managing inventory, and strengthening cash flow.
- Enhanced profitability: Several metrics, such as net sales, gross margin, and operating margin, help CPG companies evaluate their profitability. Other KPIs, such as trade spend ratio, measure the success of efforts to increase profitability. Together, such KPIs can help CPG companies identify opportunities to reduce costs and boost revenue.
- Optimized inventory management: Many CPG businesses struggle to efficiently keep up with demand, which means accurate inventory management planning and tracking are crucial. Companies can reduce stockouts and avoid costly overstocking situations by closely monitoring inventory turnover ratio sell-through rate, and similar KPIs.
- Better demand forecasting: Through consistent analyses of sales and distribution KPIs, businesses get more accurate and up-to-date information about the demand for their products. This data can lead to more precise forecasts and more accurate production schedules.
- Increased supply chain efficiency: Lead time, on-time delivery rate, and other metrics help companies identify supply chain bottlenecks so they can streamline logistics and order fulfillment. For example, if KPIs indicate distribution inefficiencies, a business might choose to implement just-in-time inventory management to upgrade its network.
- Higher customer satisfaction: Tracking—and acting on—the right KPIs can help companies maintain consistent product availability and timely delivery, resulting in happier customers. By tracking order fulfillment rates, on-shelf availability, and other metrics, businesses can proactively identify and address problems that could lead to stockouts, shipping delays, and other negative customer experiences.
- Stronger trade spend management: CPG companies often overlook the effects of trade spend—the cost of rebates, discounts, and other incentives—in their accounting and planning, which can distort forecasts and profitability. Proper tracking of trade spend ratio and ROI generates accurate data about the performance of promotions, allowing companies to maximize the value of their trade spend initiatives.
- Improved cash flow: KPIs that analyze receivables, payables, and liquidity, such as CCC and days sales outstanding (DSO) can present CPG business managers with a clear picture of a business’s current cash flow. They provide valuable data that helps make runway projections and cash flow forecasts more accurate.
- Competitive advantage: Companies that compare their KPIs to their competitors’ and to industry standards can obtain a clear and precise picture of how they measure up. Then they can act to double down on their strengths and shore up their weaknesses.
- Regulatory compliance and reporting: Accurately tracking KPIs can be crucial for maintaining regulatory compliance—for example, in labeling and packaging, which often bring a heavy compliance burden to CPG companies. Monitoring and reporting on certain KPIs, such as compliance rate, label accuracy rate, and time to compliance, can help CPG companies improve their compliance processes and avoid costly mistakes.
14 Most Important CPG KPIs
With so many KPIs available, it’s easy for CPG companies to get lost in the data and end up in “analysis paralysis.” But some metrics stand out as essential indicators of financial stability, operational efficiency, and customer loyalty. These are the most important KPIs for CPG businesses to monitor.
1. Cost of goods sold (COGS):
COGS tracks the direct costs of producing the goods that a company has sold in a given period, including labor, raw materials, factory supplies, and manufacturing overhead. It does not include corporate overhead, marketing, or selling expenses. Because it includes manufacturing overhead, effective cost allocation is a prerequisite for successful COGS tracking. The formula for COGS is:
COGS = (Beginning inventory + Purchases) – Ending inventory
2. Gross margin:
This metric, which can be measured by individual product, product category, or the entire business, reports the profitability of production without accounting for indirect business costs. It is simply the percentage of sales revenue left after subtracting COGS. CPG companies use it to assess how profitable specific products are, evaluate sourcing and production efficiency, and identify opportunities for optimizing costs and pricing. The formula for gross margin is:
Gross profit margin = [(Sales revenue – COGS) / Sales revenue)] x 100
3. Inventory turnover ratio:
CPG companies use this ratio, which measures how often they sell through and replace their stock in a given period, to assess the efficiency of inventory management—which is crucial for companies that sell perishable goods or seasonal products. It also helps companies make more data-driven inventory management decisions, such as adjusting production schedules to avoid future overstocking in response to a low ratio. The formula for inventory turnover is:
Inventory turnover ratio = COGS / Average inventory value
4. Sell-through rate:
This vital KPI tracks a company’s efficiency in converting inventory into revenue and offers insight into sales performance. Sell-through rate is expressed as a percentage, calculated by dividing the number of units sold at retail by the number of units the retailer received. High sell-through generally indicates strong demand and efficient inventory management, while a low rate suggests overstocking or weak demand. CPG businesses rely on this metric to identify top-performing items, adjust inventory strategies, and plan promotions to clear slower-moving products from shelves. The formula is:
Sell-through rate = (Number of units sold / Number of units received) × 100
5. Trade spend ROI:
CPG companies measure trade spend ROI to assess the effectiveness of their promotions—i.e., the discounts, rebates, in-store signage, and other incentives they offer to retail partners. Accurate accounting of these expenses is crucial to avoid distorting profitability data and forecasts. To calculate this metric, divide the revenue attributable to promotional activities by the total amount of trade spend. The formula can also be applied to individual trade promotions, enabling companies to compare them and adjust spending to the most effective initiatives. The formula is:
Trade spend ROI = (Incremental profit – Trade spend) / Trade spend
6. Days sales outstanding (DSO):
Because many CPG companies tend to rely on a few large customers, slow payments from one retailer can significantly affect a manufacturer’s cash flow. This makes DSO, which measures the average length of time it takes to collect payment for goods purchased on credit, a particularly important metric. Calculate DSO by determining the average accounts receivable (AR) for a specific time period and dividing it by the total value of credit sales made during that time. Then multiply that number by the number of days in the period. The formula is:
DSO = (Average AR in period / Credit sales made in period) × Number of days in period
7. Days payable outstanding (DPO):
Think of DPO as a kind of reciprocal, or mirror, of DSO; it measures the average number of days a company takes to pay its suppliers. Though seemingly simple, savvy CPG companies can apply DPO to several strategic purposes. For example, a higher-than-average DPO could mean that a company is having cash flow problems and finding it hard to make payments—or it could mean that the company has a powerful negotiating position that allows it to extend DPO, thus freeing up cash for other purposes. DPO can be an indispensable tool for working capital management, cash flow optimization, seasonal business management, and risk management because it helps a CPG company manage the timing mismatch between when it pays suppliers and when it is paid by retailers. The formula is:
DPO = (Average accounts payable / COGS) × Number of days in period
8. Days inventory outstanding (DIO):
DIO is the average number of days a company holds its inventory before selling it. This metric is most important to CPG companies that sell food, beverage, and personal care products because it measures the efficiency of inventory management operations. Because such products have expirations dates, a very low DIO—which indicates highly efficient inventory management—is essential. The formula for calculating DIO is:
DIO = (Average inventory / COGS) × Number of days in period
9. Cash conversion cycle (CCC):
CPG companies face unique cash flow challenges, such as extended retailer payment terms, high up-front inventory costs, and fluctuating demand. They use CCC—an indicator of liquidity and cash flow efficiency that combines the three previous KPIs (DSO, DPO, and DIO) into one simple equation—to help them stay ahead of these challenges. CCC monitors how long it takes to convert cash into inventory and then back into cash. It can shed light on hitches in inventory management, sales, and customer collection processes and can highlight opportunities to strengthen supply chain operations. The formula for CCC is:
CCC = (DIO + DSO) – DPO
10. Customer retention rate (CRR):
This metric monitors a company’s percentage of repeat customers over time—an indicator of consistent demand for high-quality products, successful brand loyalty programs, effective positioning, and customer satisfaction. Here’s the formula to calculate retention rate:
CRR = [(Number of customers at end of period – Number of customers acquired in period) / Number of customers at start of period] × 100
11. On-time in-full (OTIF) delivery rate:
This KPI plays a major role in analyzing delivery performance, which is critical for CPG companies tasked with meeting high retailer and customer demands while managing complex supply chains. It helps ensure that their products will be available when needed, so they avoid lost sales and maintain strong retail partnerships. Calculate OTIF rate by dividing the numbers of orders delivered on time and in full by the total number of orders placed. The formula is:
OTIF = (Number of OTIF orders / Total number of orders) × 100
12. Market share:
CPG businesses use market share to monitor and assess their overall standing vis-à-vis the competition. This data helps businesses create new positioning, marketing, and sales strategies to differentiate themselves from others. To calculate market share for a company, divide its total sales in a specific category by the total sales of all companies in that category. The formula is:
Market share = (Company’s sales / Total market sales) × 100
13. Total sales:
These are actually many metrics that track the overall revenue generated in a specific period in multiple ways. CPG businesses often measure total sales by product (for example, shampoo, conditioner, and hair gel) or by channel (ecommerce, big-box stores, grocery stores) to identify high-performing items and the most effective ways to distribute them. Companies may also conduct per-store analyses to track their top retail partners. Each of these is presented as a single number—i.e., the total sales for the product, channel, or store—so there is no formula.
14. Return rate:
By monitoring and analyzing return rate, companies can identify and address potential issues surrounding product quality and customer satisfaction. If rates are above accepted benchmarks for specific products, they likely indicate problems that could threaten a business’s revenue and profitability. The formula is:
Return rate = (Number of units returned / Number of units sold) × 100
Challenges in Measuring CPG KPIs
Tracking KPIs comes with significant challenges that can compromise CPG companies’ data accuracy and decision-making processes. Manual reporting, fragmented supply chains, and evolving customer trends make it difficult to maintain reliable performance metrics and compare them to relevant benchmarks. These are some of the most common challenges that businesses face:
- Data accuracy issues: The distributed nature of CPG manufacturing, distribution, and sales, coupled with the industry’s historical reliance on manual processes, leads to errors in data collection and reporting. For example, individual retail store managers may count inventory by hand and write numbers down on paper before entering them into spreadsheets. KPIs that rely on inconsistent or incomplete data will generate inconsistent, incomplete analyses.
- Lack of real-time tracking: Manual processes can also create delays in reporting, further jeopardizing the accuracy of data. If a manager counts inventory at the end of their shift but doesn’t enter their counts until the start of the next day’s shift, that data will likely have become outdated overnight. And that bad data could result in bad decisions, such as a company ordering too much or too little of a particular product.
- Complex supply chains: The complexity of CPG companies’ supply chains—particularly the multiple distribution and retail partnerships that they rely on—makes inventory tracking difficult. Aggregating and analyzing data from each stakeholder takes up valuable resources that companies could better spend elsewhere, and it creates inaccuracies and inconsistencies that taint KPI data.
- Fragmented data sources: Aggregating data from multiple internal teams, such as sales, marketing, and finance, can be challenging if they use disparate, disconnected systems. Without a centralized data management system, companies struggle to maintain consistent reporting standards and generate accurate, real-time KPI measurements across departments.
- Retailer and distributor variability: Retailers and distributors may all have their own data reporting standards and sharing processes, which complicates efforts to standardize on important KPIs. Manufacturers’ agreements with these companies are often complex, and a misunderstanding of their details can result in misreported sales figures and improper revenue recognition.
- Trade spend measurement: The big challenge CPG companies face here is accurately attributing the promotional expenses paid to retailers or distributors. Failing to properly account for these expenses can artificially inflate their profitability metrics, which, in turn, can lead to poor decision-making and resource allocation. Accurately attributing trade spend to sales—a key component of calculating trade spend ROI—is another challenge, because promotions often have delayed or indirect effects on final purchases.
- Evolving consumer trends: Rapid changes in consumer behavior, such as the pandemic-accelerated shift to more online shopping, make it difficult to maintain accurate forecasting. Without real-time tracking and analytics tools, companies can’t quickly adapt to new conditions, resulting in KPI measurements based on outdated benchmarks. Evolving customer demands also require businesses to track new metrics; growing concerns about environmental sustainability have led to heightened focus on such KPIs as carbon footprint per product, for example.
- Regulatory and compliance challenges: Evolving industry standards also affect KPI benchmarks. Changing regulations, such as revised food safety standards or environmental reporting requirements, may require companies to adopt new data collection methods or production processes, for example. As a result, companies must update their benchmarks to maintain accurate measurement, ensure compliance, and avoid penalties.
- High volume of SKUs: Many CPG companies make and sell multiple diverse product lines, which complicates efforts to consistently manage performance metrics. Some goods may have smaller, less efficient production runs than others, requiring different metrics and benchmarks to fairly assess their performance. Monitoring and analyzing the operational results of a proliferation of SKUs each with their own unique KPIs, is a challenging task—made more so if done manually.
- Technology integration issues: As illustrated by many of the issues above, CPG companies may struggle with technology integration at multiple levels. For example, disparate legacy systems can’t always support the advanced analytics that CPG manufacturers increasingly require for tracking KPIs. Challenges also arise from incompatible data formats among business partners and inconsistent API connections with retailer systems. Without good integration among inventory management, production, point-of-sale, and warehouse management systems—and, of course, financial software—companies cannot generate the real-time, accurate KPI measurements needed for effective decision-making. This can pave the way to manual workarounds that introduce errors and delays in reporting and, ultimately, KPIs that may not accurately disclose a company’s performance.
Grow and Manage Your Business With NetSuite
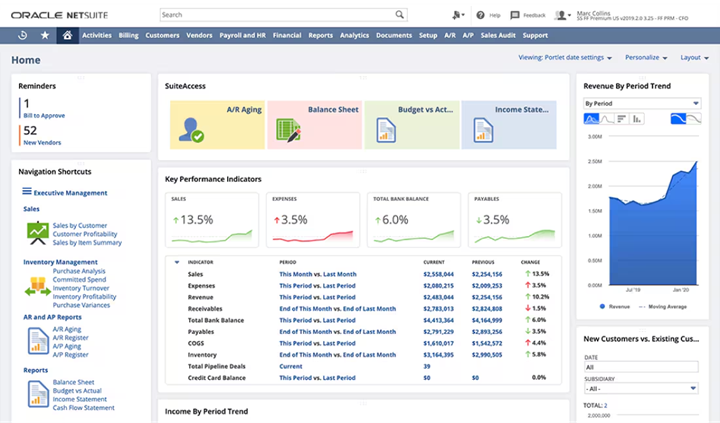
CPG companies need complete visibility into their operations—supply chain, manufacturing, warehousing, sales, marketing, order management, finance, and more—so they can monitor their most important KPIs in real time. By integrating with multiple systems and unifying data on one cloud-based platform, NetSuite’s ERP enables real-time KPI monitoring and reporting that eliminates manual data collection or reconciliation. It lets CPG business leaders make strategic decisions based on trusted, up-to-date information.
Furthermore, NetSuite’s automated workflows help ensure consistent data collection and standardized reporting processes, while its analytics capabilities, powered by artificial intelligence, help companies track and analyze crucial metrics, including inventory turnover, cash conversion cycle, and trade spend ROI. Built-in dashboards provide instant visibility into these performance metrics, helping CPG business leaders make faster, more informed decisions to optimize operations and drive growth.
KPIs give CPG companies the data and insights they need to measure performance and make more informed decisions to optimize operations. By tracking key sales, inventory, distribution, profitability, and customer engagement metrics, CPG companies can identify opportunities to improve efficiency and increase market share. Automated, cloud-based software platforms help them navigate the challenges of collecting and analyzing data from disparate sources and systems. As CPG competition continues to intensify, these and other emerging technologies—such as AI and predictive modeling—will become necessities for successful businesses.
CPG KPIs FAQs
What does CPG mean?
CPG means consumer packaged goods, a term for products that customers buy, use, and rebuy on a regular basis. Big-box stores, grocers, and pharmacies sell these products, which include food, clothes, and cleaning supplies.