If a key supplier went down tomorrow, how quickly could you trace the impact through your network? And, just as important, how would you respond? If the honest answer is, “Slowly, and without a clear plan,” you’re not alone. Even some of the biggest, most successful companies have discovered their dependencies only once a disruption was underway—like when a fire at a sole-source supplier nearly halted Boeing’s aircraft production in 2007, or when the 2020-2021 semiconductor shortage forced temporary shutdowns at GM, Ford, and Toyota.
Supply chain mapping gives companies a working blueprint of their network. Done well, it gives businesses the ability not only to spot risks and develop contingency plans but also to open up bottlenecks, seize opportunities, and even advance environmental, social, and governance (ESG) efforts.
What Is Supply Chain Mapping?
Supply chain mapping is the process of documenting and visualizing all the parties, activities, and flows involved in bringing a product from its raw-materials beginnings to its end-customer delivery. In practice, it means creating a detailed map of a company’s supply network—often including information on raw material suppliers (and where they’re located), how materials and components move through factories and distribution centers, what transportation modes are used, and the typical timelines for shipments.
Key Takeaways
- Supply chain mapping creates a complete overview of how goods, data, and payments progress along the path from raw materials to customers.
- Supply chain mapping is most valuable when treated as a living practice, with regular updates and validation against real-world data.
- The insights gained can improve resilience, efficiency, and compliance, as well as support ESG goals.
- Software platforms that centralize supply chain data can make it easier for companies to build, maintain, and act on maps.
Supply Chain Mapping Explained
Supply chain mapping creates a genuinely holistic visualization of a company’s supply network. Every component and interaction is captured, from suppliers and manufacturers to warehouses, distributors, retailers, and everything in between. This includes how goods, information (orders, shipments, data), and payments flow from one step to the next.
To be most effective, this visualization can’t stop at tier 1 suppliers—that is, the companies you buy from directly. An immediate supplier might look stable, but if the companies they buy from (your tier 2 suppliers) are concentrated in one region or rely on a single raw material, your business is still at risk. The same holds true further upstream. Tier 3 suppliers (those providing raw materials, specialty chemicals, or highly specialized components) control critical inputs that can quietly become single points of failure. Consider, for instance, the tier 3 semiconductor suppliers that upended global automotive production during the chip shortage. Supply chain mapping aims to peel back every layer of these relationships, revealing critical dependencies and interconnections that help companies anticipate risks, improve operations, and make smarter trade-offs.
Supply chain mapping isn’t a one-time exercise, though. Supply chains are dynamic: Suppliers change, new logistics routes open up, demand fluctuates, and unforeseen events occur regularly. Keeping the map updated is part of good supply chain management, so decisions always reflect the current reality of how goods and data actually move.
Why Is Supply Chain Mapping Important?
Supply chain mapping transforms assumptions into facts. Say a food manufacturer charts its supply chain for a given product. The map shows a key ingredient sourced from Southeast Asia, shipped by sea to a US port, trucked to a domestic plant for production, and incorporated into final products that are ultimately routed through distribution centers before reaching customers. With that end-to-end view, leaders can ask practical what-if questions: What happens if the port closes, or if the overseas supplier has a disruption? Without a map, those questions are guesswork; with a map, the risks and dependencies are laid out clearly enough to plan around.
Mapping also forces a level of rigor that companies sometimes skip, one that reveals weak links, hidden dependencies, and even opportunities to improve performance that would otherwise stay buried. And because the mapping process requires input from procurement, logistics, operations, and suppliers, it can strengthen collaboration throughout the entire supply chain.
How to Map the Supply Chain Step-by-Step
Mapping the supply chain can sound daunting, especially for companies with a large or global network. Breaking the project into clear steps can make it manageable—it’s also wise to assemble a small team to spearhead the process, including members from procurement, operations, logistics, and IT (if data systems are involved). Assigning a project lead or coordinator can help the effort stay on track. Below is a step-by-step approach to supply chain mapping, with practical tips and insights for each phase:
-
Define Your Objectives and Collect Data
Start by clarifying why you’re mapping: Is it to reduce risk? Cut lead times? Manage costs? Support sustainability goals? Whatever the reason, scope your pilot accordingly. Clear objectives prevent teams from drowning in data that doesn’t actually serve the goal. To make things easier to manage, start small, with one critical product family, SKU cluster, or region.
Next, gather core internal records, including your supplier master list, bills of materials, purchase order history, shipment and carrier data, invoices, and quality logs. Ask suppliers for key inputs, such as sub-tier sources and lead times, and standardize data entry fields so names, IDs, and locations line up consistently. Assign ownership for keeping the data current—the map is only as reliable as the information behind it. While this is generally the most labor-intensive step, the payoff is a solid foundation.
-
Identify Key Stakeholders and Suppliers
With the scope defined, bring in the people who know the supply chain best. Internally, that often means staff from procurement, logistics, operations, finance, compliance, and IT. Externally, engage tier 1 suppliers for details about their operations and critical inputs, as well as introductions to sub-tier suppliers. Don’t assume they won’t cooperate; be transparent about the mutual benefits, offer NDAs or incentives if needed, and frame mapping as a resilience exercise for everyone.
Be sure to include carriers, warehouses, third-party logistics providers, brokers, and customs agents. They tend to operate behind the scenes and can, therefore, become hidden points of failure. The more stakeholders and partners that contribute, the more accurate and actionable the map becomes.
-
Map the Flow of Goods
Now, it’s time to build the visual map. Start with raw material sources and trace each step through suppliers, factories, logistics partners, warehouses, and distribution centers until the final product reaches the customer. Add useful details, such as capacity, cycle times, transport mode, inventory points, or quality data. This creates a reference guide that turns the map into a decision-making tool rather than just a diagram. Depending on the goal, you might create different versions of the same map—for instance, a geographic map that plots suppliers on a world map to show regional risks, or a process map that lays out steps in order, with timelines to spot long lead times.
Strive for completeness, but focus first on the details that matter most to your objectives. The idea is to create a map thorough enough to guide decisions without becoming so cluttered that it obscures what matters. Even early drafts can reveal hidden dependencies, and additional details can always be layered in over time.
-
Analyze Potential Risks and Opportunities
A map is only as useful as the analysis that follows. Once the map is complete, focus on the biggest supply chain risks, such as single-source dependencies, geographic clusters, and blind spots beyond tier 1 that may hide ESG or compliance issues. Long transit legs or ingrained habits—like defaulting to air freight—can also quietly drain margins. Test what-if scenarios (a port closure, a demand spike, a currency swing) to see how disruptions could ripple through the network and where response plans are needed.
Just as important, use the map to spot opportunities for greater supply chain efficiency. Redundant distribution legs, unused capacity, or costly logistics workarounds often become obvious once flows are visualized. You may find savings by consolidating volume with one supplier, or resilience by splitting it across two. The key is to link each risk or opportunity to revenue at stake, service impact, or mitigation cost so you can prioritize contingencies effectively.
-
Validate the Map
It can be tempting to jump to action, but it’s important to confirm that the map reflects reality. Bring together your team of stakeholders from earlier to trace an order from raw materials to customers. This review can expose errors or omissions, like an overlooked distributor or a shipping lane mislabeled as air when it’s mostly ocean. Cross-check with real shipment data, such as planned versus actual lead times, on-time-in-full rates, transit and dwell time by lane, and carrier tracking events.
Validation also builds trust and ownership. When the people closest to the work correct and confirm the map, it becomes a shared source of truth. Record a version date for every update and keep a brief change log, so teams don’t work from different maps. Noting data sources can keep updates repeatable and auditable.
-
Act on Insights
A common failure point when mapping a supply chain is stopping at analysis and validation. There’s little point to all the legwork if the map is never used to convert insights into projects with accountability. But when acted on, the map shifts from being a static diagram to becoming a tool that can be used to cut costs, strengthen resilience, and improve service.
Translate risks and opportunities into a prioritized action plan with clear owners and deadlines. High-impact measures often include preapproving backup suppliers, diversifying transport lanes, or adding targeted safety stock. On the efficiency side, maps often point to quick wins, such as cutting out redundant legs or shifting freight from air to ocean.
-
Reanalyze and Update Map
Supply chains evolve constantly—due to new suppliers, shifting trade rules, fresh disruptions—so a map quickly loses value if it isn’t maintained. Treat it as a living tool by scheduling reviews quarterly or semiannually, and update it whenever you onboard a supplier, shift production, or hit a major snag. Even small refreshes, such as updating lead times or transport modes, can help prevent blind spots from creeping in.
The biggest pitfall is complacency. Some businesses map once, then shelve it until the next crisis exposes flaws. Resilience comes from keeping the map current and weaving it into sales and operations planning, risk reviews, and procurement planning. When it’s refreshed regularly and embedded in decision-making, the map is elevated from a one-off project to an operating asset.
Benefits of Supply Chain Mapping
Nearly 80% of companies’ supply chains were disrupted in 2024, with most facing between one and 10 disruptions. In other words, disruptions are all but inevitable—but mapping is a way to mitigate their impact. An end-to-end view of the supply chain makes it easier to spot risks, cut waste, and strengthen collaboration—and each gain reinforces the next. A clearer picture of the network supports faster decisions, which, in turn, improves efficiency, reduces costs, and creates room to invest in sustainability. The result is a supply chain that’s more resilient, efficient, and trusted.
More specifically, supply chain mapping:
- Visualizes the full supply chain: Mapping provides a big-picture, end-to-end view of your entire supply network, often pulling together data that wasn’t previously in one place. This improves supply chain visibility by showing exactly where suppliers, plants, warehouses, and transport links sit in relation to one another—so stakeholders can clearly see how the pieces connect.
- Enables deeper insights: Once the network is mapped, patterns start to emerge, such as duplicated freight legs, chronic delays tied to a single shipping lane, or supplier overlap in the same high-risk region. These pain points aren’t always obvious in siloed systems, but a consolidated view makes them clear and actionable, leading to smarter decisions.
- Surfaces potential risks: A detailed map acts like a diagnostic lens that exposes vulnerabilities, such as suppliers in financial distress, overreliance on a single transport lane, or regulatory red flags buried in sub-tiers. With those weak points revealed, companies can put contingency plans or alternative sources in place before a disruption turns into a crisis.
- Identifies bottlenecks and optimization opportunities: Supply chain mapping highlights where delays, redundancies, or excess costs creep in—perhaps a distribution center that’s adding unnecessary days, overlapping freight legs, or inventory sitting idle. By making these choke points visible, companies can redesign routes, trim lead times, reduce carrying costs, and eliminate wasted steps.
- Supports ESG efforts: With regulators and customers demanding proof of due diligence, mapping can give companies the data foundation they need to meet reporting requirements and sustain meaningful ESG progress. Greater transparency into where and how products are sourced, for instance, can help reveal suppliers with issues like high emissions, poor labor practices, or links to sensitive regions so they can be replaced or otherwise addressed.
Supply Chain Mapping Use Cases
Although supply chain mapping can deliver broad value, companies often launch projects in response to a pressing challenge or opportunity—such as in response to a disruption, preparing for new reporting rules, or finding ways to cut costs. In practice, three common use cases are:
- Responding to disruption: Say a critical supplier, port, or lane goes offline and you want to know who—or what—will be most affected. Mapping is used to trace dependencies through multiple tiers and simulate knock-on effects in different scenarios, making it possible to create realistic contingency plans that can help operations keep moving, in spite of disruptions. After the semiconductor shortage, for instance, many manufacturers used supply chain mapping to learn that some tier 1 partners were dependent on the same tier 3 chipmakers, leaving the industry exposed to a single upstream bottleneck. This revelation helped provide a path to diversifying sourcing to mitigate future shocks.
- Meeting ESG and compliance mandates: With pressure from consumers and regulatory bodies, more companies need to not only prove where materials come from but also flag things like forced labor or the use of conflict minerals. In such cases, supply chain mapping can help companies trace raw materials and supplier operations beyond their tier 1 suppliers, as well as validate claims. For example, Adidas was able to enhance its traceability of recycled polyester by linking purchase orders, supplier declarations, and certifications through supply chain mapping, as well as tracking sustainability claims through upstream suppliers.
- Supporting network redesign: Without mapping, it’s hard to see how the supply chain network actually functions day to day. For example, a company may suspect inefficiencies but not know where they originate. Once flows are mapped, problems, such as overlapping warehouses, circuitous routes, or rising logistics costs, become far easier to pinpoint and fix. In the mid-2000s, John Deere redesigned its global network by incorporating merge centers (facilities that consolidate shipments from multiple suppliers into a single load) and reconfiguring cross-dock terminals to speed up transfers. As a result, the company was able to cut transportation costs by 5% and lower global inventory costs by $1 billion over several years.
Software Is the Backbone of Supply Chain Mapping
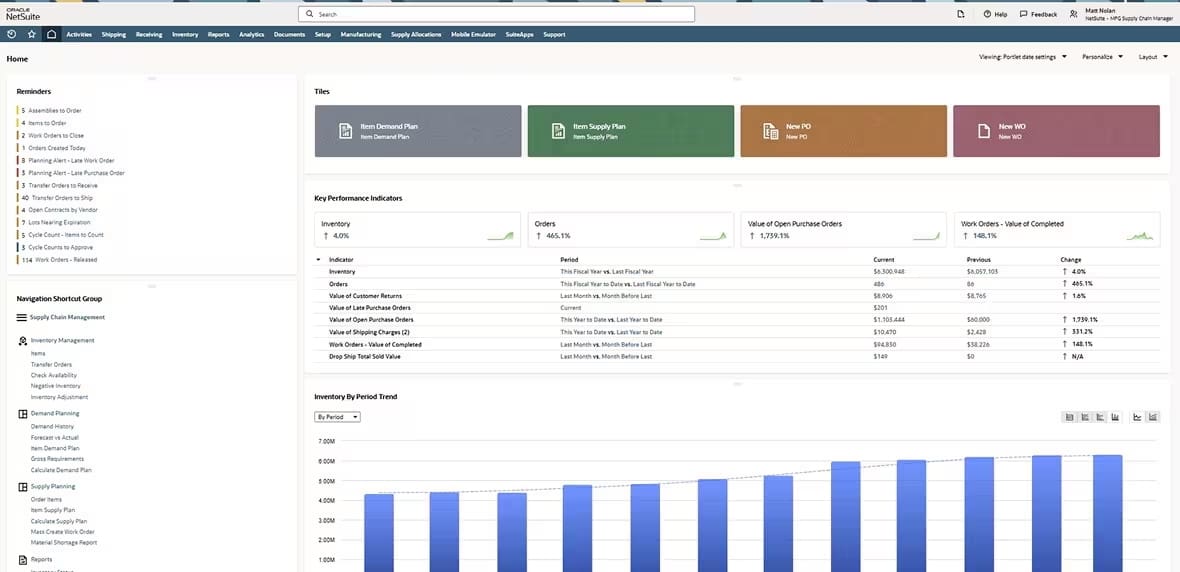
Creating and maintaining a supply chain map is data-intensive, which is why many companies turn to technology for support. NetSuite Supply Chain Management centralizes supplier, inventory, and logistics data in one system, making it easier to track flows, update records, and share information across teams. By bringing these elements together, companies gain the foundation needed to build a living supply chain map, act on both vulnerabilities and opportunities, and keep data current as conditions change.
NetSuite Supply Chain Management Dashboard
Supply chain disruptions aren’t going away anytime soon, but businesses don’t have to be caught off guard. Supply chain mapping gives companies a clear view of how their networks actually function, exposing hidden risks, revealing opportunities for greater efficiency, and providing the data necessary for regulatory compliance and sustainability initiatives.
Supply Chain Mapping FAQs
What is mapping in logistics?
Mapping in logistics is the process of visually representing routes, warehouses, and supply chain flows to optimize transportation and improve visibility. It helps companies plan efficient delivery routes, spot bottlenecks, cut costs, and respond quickly to disruptions. Essentially, it’s a blueprint that shows how goods and information move through your operations.
What is the process of supply chain mapping?
Supply chain mapping involves seven key steps:
- Define objectives and collect data
- Identify key stakeholders
- Map the flow of goods from raw materials to customers
- Analyze risks and opportunities
- Validate with real data
- Act on insights through prioritized action plans
- Regularly update the map
Because supply chains are constantly changing, it’s important to treat mapping as an ongoing process, rather than as a one-time exercise.
Why is supply chain mapping a useful tool in sustainability?
Supply chain mapping reveals where resources are used, waste is generated, and ESG risks and opportunities exist in a supply chain. This visibility helps companies improve sustainability initiatives, such as reducing carbon emissions and verifying sustainable sourcing. Mapping can be especially valuable if companies increase the scope beyond their tier 1 suppliers to trace risks and opportunities deeper in the chain.