We share everything you need to know about metrics relevant to software-as-a-service (SaaS) firms, including the most important measures, formulas, examples and calculations, as well as how to improve where necessary. In addition, our downloadable cheat sheet will help you develop your own metrics.
Inside this article:
- The most crucial SaaS metrics to track
- Why new businesses should focus on steady revenue
- How to get the metric outcomes you need
What Are SaaS Metrics?
SaaS metrics are a way to track how well your software-as-a-service business is performing. SaaS businesses are successful when they can enroll new users and keep current subscribers. SaaS metrics, when well-chosen, give you a real-time indicator of business health and growth.
Good metrics predict customer retention. They can also show how SaaS businesses can differentiate themselves from rivals, including those selling on-premises software. Strong customer retention leads to long-term relationships and, therefore, growth and improved cash flow and profitability.
To determine how you measure up, use metrics that focus on finance, marketing and sales.
What Are the 5 Most Important Metrics for SaaS Companies?
The five key SaaS metrics are churn, customer retention, customer acquisition cost (CAC), monthly recurring revenue (MRR) and customer lifetime value (CLV). These show how much money you have coming in and how effectively you gain and keep customers.
5 Most Important SaaS Metrics
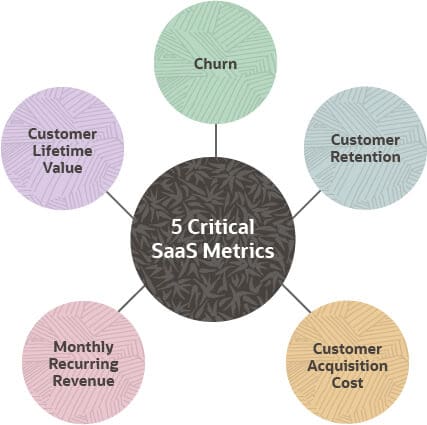
The most important of these metrics is MRR. Because a SaaS business makes most of its investments upfront, this monthly metric indicates sustainability. MRR is cash flow you can count on.
Some metrics are also key performance indicators (KPIs). Metrics track the status of business processes. They lead to KPIs when you turn them into goals and objectives that support your business’s success; translating SaaS metrics into SaaS KPIs can improve your business.
KPIs also help in benchmarking. If a KPI’s value improves without your company seeing real business results, it may not be the metric you need to track.
Key Takeaways
- Track your SaaS business metrics to ensure you’re growing sustainably.
- Use metrics and KPIs to benchmark your company within the SaaS industry.
- Calculate your MRR to convince investors your company is worth funding.
- Turn your metrics into KPIs that track your business’s growth across months or years.
Why SaaS Companies Report on Different Metrics
Different SaaS companies report on different metrics, depending on business model, growth stage and costs associated with their platforms. And, as they grow and change, their critical metrics change, too. What’s important is that a company’s metrics align with its priorities.
Mature SaaS companies with low customer churn may be less concerned with current cash flow, as they realize steady revenue over time. In addition, some providers have dominant market share in their verticals and are more focused on continually improving their software to increase customer lifetime value. Newer companies may want to keep a close eye on their cash flow as they build their revenue and customer base.
Still, three things are fundamental to every SaaS company: profitability, growth and cash. Profitability depends on revenue generated monthly, since SaaS businesses depend on subscriptions. Growth happens as marketing efforts increase name recognition. Spend too much cash on product development and you may face a crunch as that investment is not recouped until you gain sufficient customers.
For SaaS startups, key metrics are those that illuminate efficiency and growth — two things investors care about. Efficient companies are able to support investments in sales and marketing, and growth means adding, retaining and monetizing customers.
SaaS startups often face a cash flow hurdle in their early days because spending is front-loaded. For those that charge monthly, moving to a yearly payment model to establish a steady cash flow early on can be a wise change.
For example, compare the difference in one customer’s monthly payments versus charging the same customer upfront for its annual cost. In this instance, our first SaaS provider has a $2,000 customer acquisition cost (CAC), and the customer’s monthly subscription payment is $200.
Company 1: Monthly Payments
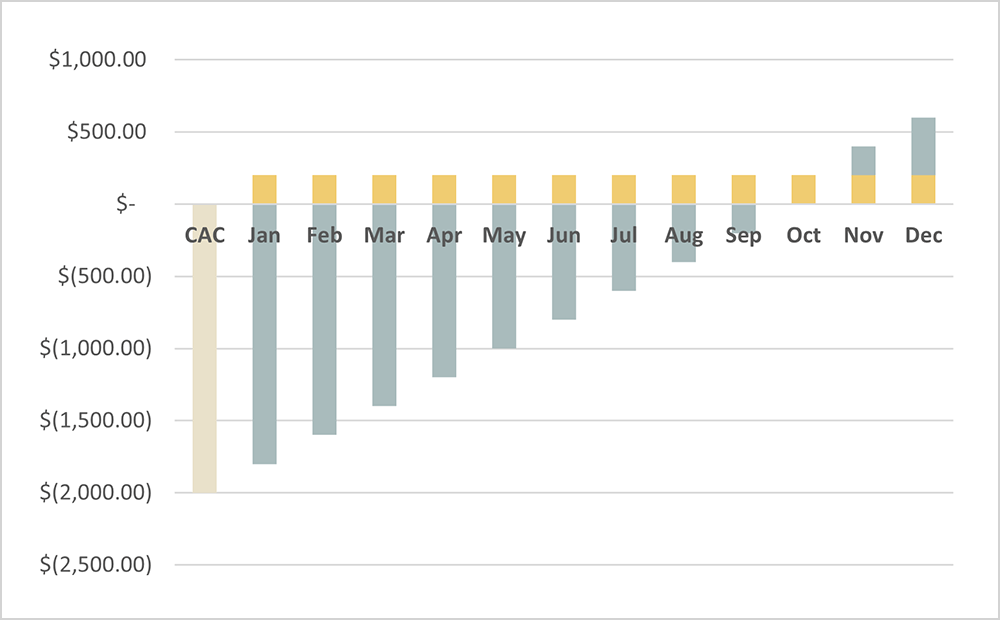
With monthly payments, Company 1 does not recoup its CAC until October. Therefore, it doesn’t have a positive cash flow until November.
Company 2: Annual Payment
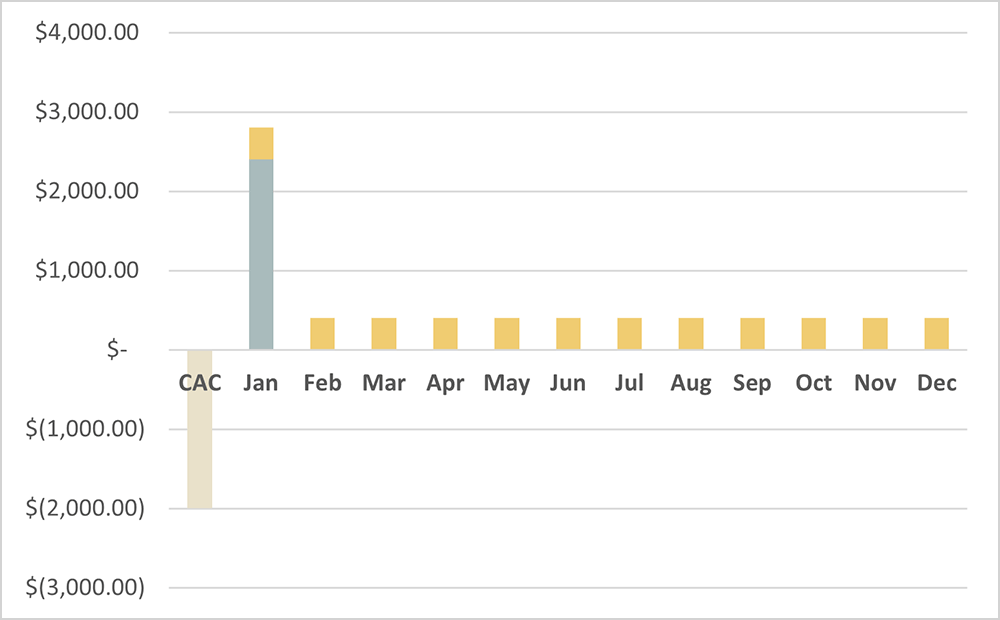
With an annual upfront payment, Company 2 has a cash flow of $400 right away. It can spend more on customer acquisition and kickstart growth.
Popular SaaS Metrics by Function
Successful SaaS businesses use a variety of metrics based on their growth rates, industries and size. Still, popular SaaS metrics tend to land in three buckets: finance, sales and marketing.
SaaS financial metrics
Financial metrics measure your business’s health and profit potential. Often, traditional finance metrics don’t translate well to SaaS businesses that rely on digital products and a recurring revenue model. Instead, use the following SaaS operating metrics:
Monthly recurring revenue (MRR):
MRR measures how much revenue a SaaS company expects to receive monthly. MRR is a straightforward measure of how many customers you have and how much you receive from them monthly.
MRR = total accounts for the month x rate in $ per account
Tracking this metric as a KPI reveals if your revenue is going up or down over time. For example, if you have 2,000 customers paying a rate of $20 per month, you can expect your MRR to be $40,000. There are alternative methods of calculating MRR if, for instance, your customers use different payment plans or tiered accounts. In this case, you could determine an average monthly revenue from all customers and multiply it by the number of current customers.
Churn rate:
Also known as customer churn, churn rate is the percentage of a SaaS provider’s customers who cancel their subscriptions. Calculate churn rate by dividing the number of customers canceling their subscriptions per month by the number of customers at the beginning of the month. You can also set the interval on this metric for a year.
Churn rate = (# customers canceling / total # of customers) x 100
Churn is a vital metric for SaaS companies looking to forecast revenue. For example, if you have 20,100 customers and 600 canceled their subscriptions this month, your churn rate would be:
Churn rate = (600/20,100) x 100 = 3%
In SaaS businesses, decreasing churn by 5% can boost profits significantly. Happy customers not only increase their CLV but are also more likely to recommend your product.
Average revenue per account (ARPA):
Also called revenue per customer, ARPA is the revenue each customer generates per account — remember, customers may have multiple users or sub-accounts. Calculate your ARPA by dividing your monthly recurring revenue (MRR) by your total accounts.
ARPA = MRR / # of accounts
This metric is essential to track when you want to see if your pricing is appropriate and to understand how your business is expanding. For example, if your MRR is $50,000 and you have 1,000 active accounts, your ARPA is $50,000/1,000 = $50. You can also adjust the figures to compare different types of accounts or groups.
Customer acquisition cost (CAC):
CAC represents all the sales and marketing costs required to bring on new customers within a given period. Calculate CAC by adding up the total cost of sales and marketing for a period and dividing by the number of new customers for that period.
CAC = total cost of sales and marketing / # new customers
For example, say that in a month, you spend $18,000 in sales and marketing, including salaries, tools and specific programs, and acquire 500 new customers. Your CAC is:
$18,000 / 500 = $36 per customer
If a competitor is more efficient in its sales and marketing spend and charges the same, its calculation might be:
$15,000 / 500 = $30 per customer
Investors tend to favor companies that demonstrate a lower CAC.
Customer lifetime value (CLV):
Customer lifetime value is the total amount of money your business receives or expects to receive from a customer over the lifetime of that account. CLV is a more accurate view of revenue potential than CAC, although the two figures intertwine. Calculate CLV by multiplying the customer’s average revenue by the length of its contract. You can also calculate CLV by dividing ARPA by the churn rate.
CLV = (1 / churn rate) x ARPA
For example, using the figures in the calculations above, a company has a 3% churn rate with a $50 ARPA for the month. For its monthly contracts, the CLV is:
(1 / 0.03) x $50 = $1,667
Use CLV as a gauge of what you can spend on CAC, aiming for a ratio of at least $3 of CLV for every $1 in CAC. A business with a current scenario of CAC = $36 and CLV = $1,667 is likely very profitable.
Customer attrition rate:
Customer attrition rate, also known as customer turnover, is the rate at which you lose customers over time. This metric differs from churn rate in that it doesn’t account for the net total including new users. It focuses only on customers lost.
This measure is vital to track monthly or annually to spot an uptick in customer dissatisfaction. Calculate your customer attrition rate by dividing the number of customers leaving by your total number of customers in the period.
Customer attrition rate = (# of customers leaving / total # of customers) x 100
For example, last month, a company lost 200 of its 13,000 subscribers. Its customer attrition rate is:
(200 / 13,000) x 100 = 1.54%
Maintain a low attrition rate and you’ll spend less on acquisition. It’s always less expensive to keep existing customers than to win new ones.
SaaS marketing metrics
SaaS marketing metrics show how well you communicate your competitive advantage over rivals. For example, maybe you can offer your customers low-cost products with customization capabilities. Focus on your strengths, then judge the effectiveness of your efforts with these metrics.
Activation rate:
Activation rates, sometimes also known as sign-up to paid conversion rates, are the percent of your customers that go from newly acquired to performing an activity that signals they are using your software. Calculate activation rate by dividing the number of users who complete an activity by the number of new users who signed up.
Activation rate = (# users who activated their subscription / # of users who signed up for trial) x 100
For example, someone could sign up for the free version of your software and try it once. These acquired customers become activated only if they switch to the paid version after their free trial runs out. The better your activation rate, the more value you gain from your trial program.
A sample scenario: If 1,000 people sign up to try your software, and 700 people decide they like it enough to continue their subscriptions after their trial ends, your activation rate is:
(700 / 1,000) x 100 = 70%
Net promoter score (NPS):
Your net promoter score rates the likelihood that your customers will recommend your product to other people or companies and is based on a survey.
NPS Survey

Tracking your NPS is essential because it is a respected and standardized measure of customer success, satisfaction and loyalty. Companies can use a strong NPS to help acquire new customers; a low NPS can indicate a need to improve your offerings or customer service.
First, calculate NPS by dividing your user scores by enthusiastic promoters (scores of 9 or 10) and detractors (0 to 6). Leave out scores of 7 and 8, as they are considered passives — not displeased, but not happy enough to actively recommend your service. Then, subtract the percentage of promoters from the share of detractors.
NPS = [(# promoters / total # of survey respondents) x 100] - [(# detractors / total # of survey respondents) x 100]
For example, you have 200 respondents to your survey. Among them, 110 score you a 9 or 10, 25 score you at 6 or below, and 65 are in the middle ground. You can ignore the 65 with scores of 7 and 8 and calculate NPS like this:
[(110 / 135) x 100] - [(25 / 135) x 100] = 63
NPS scores can range between -100 and 100. What constitutes a “good” SaaS NPS benchmark depends on the specific type of software offered, business location, the demographics of your customer base and how long customers have been using the product.
Net retention rate (NRR):
Also known as net revenue retention, NRR is a churn metric. It measures the percentage of recurring revenue from existing customers.
NRR = ([(MRR + expansion revenue) - revenue lost from downgrades and churn] / MRR) x 100
NRR looks at a company’s success in SaaS renewal metrics, such as extending contracts and earning additional revenue from its customer base. First, calculate NRR by adding the previous month’s MRR and expansion revenue from upgrades and cross-sells. Then, subtract the income lost from downgrades and churn. Finally, divide this difference by that month’s MRR.
For example, say your company’s MRR last month was $40,000 and expansion revenue was $3,000. You lost $4,000 in churn and downgrades. Your NRR looks like:
([($40,000 + $3,000) - $4,000] / $40,000) x 100 = 97.5%
This figure shows that your company is not currently growing.
Annual contract value (ACV):
ACV is a metric that shows the average yearly value of a customer’s subscription. ACV helps companies figure out their strategy for sales and marketing. Calculate your company’s ACV by dividing the value of the contract by the total years of the contract.
ACV = Value of contract / # years of contract
The formula gets a little more complex when you calculate this value for multiple customers. For example, say you have three customers:
Customer A pays $800 for one year.
Customer B pays $600 per year for two years.
Customer C pays $500 per year for three years.
For year one, you have three customers. Your ACV equals ($800 + $600 + $500)/3 = $633.33. In year two, you are down to two customers, so your ACV equals ($600 + $500)/2 = $550. In year three, you have one customer, so your ACV equals $500/1 = $500.
Funnel leads:
Funnel leads are not a mathematical calculation; these are potential customers identified from organic traffic or via specific marketing campaigns. By keeping an eye on your funnel, you get great information about which content or campaigns work.
Your funnel outlines a prospect’s path to becoming a customer: From unqualified lead, to interested or marketing-qualified lead, to serious prospect or sales-qualified lead, to paying client. When sales and marketing teams work together to understand their funnel, that helps streamline the conversion process. Remember, you tend to lose prospects at every stage. Knowing exactly where prospects tend to drop out of the funnel can help you improve the marketing and sales process.
Lead velocity rate (LVR):
Lead velocity rate is the percentage increase of qualified leads over months. Calculate LVR by subtracting the qualified leads for the last month from the qualified leads for the current month, and divide the difference by the leads for the previous month.
LVR = [(# qualified leads this month - # qualified leads last month) / # qualified leads last month] x 100
This metric shows your company’s pipeline development. The pipeline is the number of potential customers you are trying to convert to actual customers. LVR is a good predictor of future growth and revenue.
For example, say a company has 200 leads this month from people checking out its website and trialing its software. Last month, 150 leads resulted from this activity. So:
LVR = [(200 - 150) / 200] x 100 = 25%
This puts the company at a 25% lead growth rate.
SaaS sales metrics
Tracking your sales metrics tells you whether your sales and customer acquisition strategy is working. Find out whether you can optimize your ad spend and how many new customers you need to achieve business milestones with these metrics.
Customer acquisition costs (CAC) payback period:
The CAC payback period is the time it takes, usually reported in months, for a SaaS business to earn what it spent acquiring a customer. Five to 12 months is a typical timespan for this metric. The CAC payback period adds context to your other metrics. Calculate the CAC payback period by dividing your CAC by the customer’s revenue brought in for the year.
CAC payback period = CAC / revenue for the year
For example, a customer costs $200 in sales and marketing spend for acquisition and pays $50/month ($600/year) for the service. Their CAC payback period is calculated as:
$200 / $600 = 0.33 years or 4 months
Average selling price (ASP):
ASP is the average price a product sells for across all customers. ASP is important because it shows investors what clients are willing to pay for your software. Calculate ASP by dividing your software revenue by number of customers.
ASP = software revenue / # of customers
For example, a company’s revenue last month was $200,000, and it had 8,000 customers. The ASP equals:
$200,000 / 8,000 = $25
The average selling price for the software per month was $25.
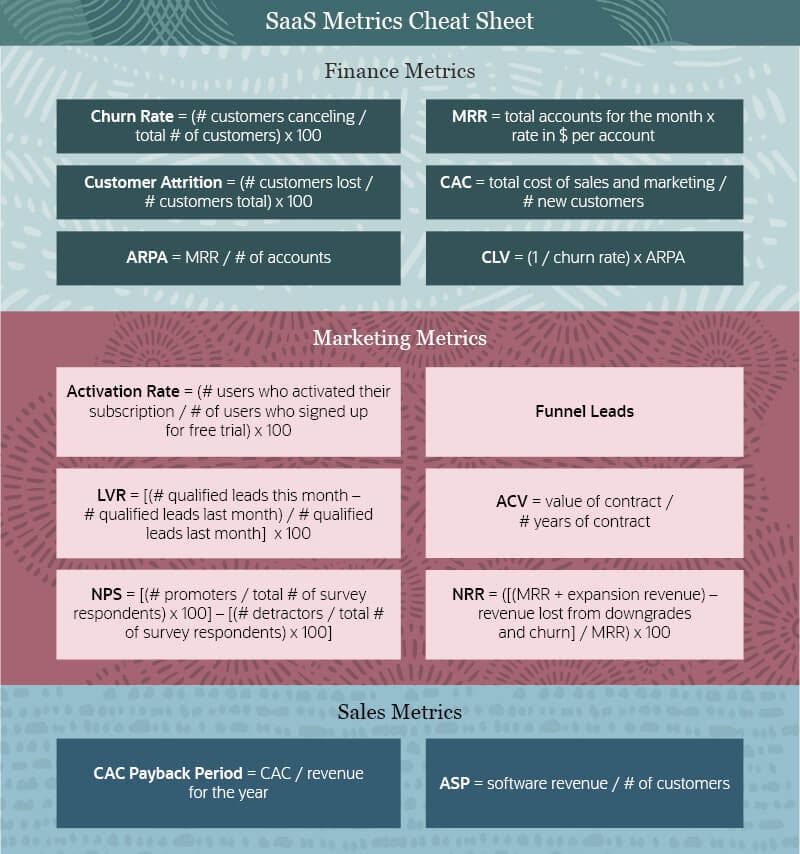
Use this downloadable SaaS metric cheat sheet to help you with your formulas:
7 Tips for Improving Metrics
Every metric you track as a KPI offers the potential to improve your business by allowing for monitoring over time. Tweak to improve when necessary, especially if you’re seeking funding.
Specific tips include:
- Conduct surveys about pricing and user behavior if your MRR is not sufficient to maintain operations.
- If your ARPA is decreasing over time, consider why you are making less from new customers. Conversely, if your ARPA is static, your business growth is suffering.
- Continue adding value to your product with expansion to increase your LTV. You can also give a discounted annual rate or offer tiered prices to improve your LTV.
- Balance your CAC by ensuring you recover your costs within the first year for new customers.
- Minimize your churn rate by focusing on keeping your current customers happy.
- Improve your activation rate by getting customer feedback with surveys, optimizing user SaaS onboarding metrics and analyzing your users’ behavior with your product.
- Use NPS to work on your retention. Customers whose NPS responses indicate they’re ready to churn need attention.
If you need to improve activation rates and/or lower CAC, consider adopting a product-led growth strategy, where the product is more responsible for driving customer acquisition, conversion and expansion than sales or marketing.
Software to Optimize Your SaaS Business Goals
Make decisions and grow your SaaS business using data. First, consider SaaS dashboards to track your KPIs and metrics consistently and continuously. Then, use these insights as inputs to inform your business intelligence efforts to understand your company’s position, challenges and advantages.
To be successful from the onset, SaaS startups should develop a scalable, integrated and unified business infrastructure that gives both investors and staff visibility. That helps you get capital for initial growth, prove your business model works, then prepare to scale.
If possible, select a system that records all your transactions from Day 1 and provides a visual platform for actionable data and metrics. Even in the early days, you will want access to simple metrics such as revenue, customer acquisition cost, churn and average selling cost.
Learn How to Optimize Recurring Revenue With NetSuite
Recurring revenue is at the heart of any SaaS business; that’s why managers need a tool that tracks and manages subscriptions and maintenance renewers. NetSuite’s Software Edition has a custom engine designed to meet the needs of perpetual license software providers and SaaS businesses. Use NetSuite’s tools to consolidate global financials and automate billing across multiple revenue streams: subscription, product, usage and services. Let the No. 1 cloud ERP be your guide.


