
In the words of famed management consultant Peter Drucker, “what gets measured gets managed.” That holds true for sales results and the people responsible for driving them; their efforts go a long way in determining whether a business is profitable. Fortunately, most businesses already have plenty of sales data at their disposal. The key is to identify which metrics are most useful to the business and how to interpret them to assess and forecast performance. Top-performing sales teams use their data to remain laser-focused on achieving or exceeding their sales goals.
What Are Sales Metrics?
Sales metrics are data points that measure and evaluate an individual, team or company’s sales performance over a period of time. In the big picture, sales metrics help an organization analyze the success of its sales initiatives, as well as identify areas that might need improvement. They also inform sales strategies, monitor goals and objectives, and track progress, while providing other critical business insights.
Key Takeaways
- Sales metrics can help companies identify operational and performance trends that impact sales outcomes.
- Effective use of sales metrics can help leaders drive better performance, more accurately forecast sales, and meet their overall business objectives.
- Not all sales metrics are sales KPIs; KPIs are the metrics that show performance against a business goal.
- The relevance of specific sales metrics depends on the viewer’s role and responsibilities.
Sales Metrics Explained
Tracking the right mix of sales metrics provides a high-fidelity view into how effectively the sales team is moving through the pipeline and converting deals. Different metrics provide different snapshots—some reflect activity levels, like the number of calls made or tools used daily; others speak to outcomes, such as average deal size, conversion rates, or sales cycle length. While activity-based data offers a rough sense of team effort, outcome-focused metrics tend to provide a more accurate read on performance and progress.
Taken together, these metrics can reveal patterns that inform and shape sales strategies. A drop in conversion rates over time, for example, might prompt leadership to dig into other metrics, such as number of demos completed or lead response time, to pinpoint where deals are stalling. If deals slow after proposals, the pitch may need refining. Sales metrics can also signal issues in pricing, contract workflows, or training needs. For instance, strong email open rates but low response rates might suggest a need for better follow-up messaging. Or if sales cycles are getting longer, it might be a sign that the company needs to streamline contract approvals.
Sales metrics can also give leadership another facet of business performance. If outreach is strong but a product still underperforms, it may be time to rework its positioning or feature set. By adding this angle, sales data helps widen the lens for understanding what’s working—and what isn’t—across the entire customer journey.
Sales Metrics vs. Sales KPIs
While closely related, sales metrics and sales key performance indicators (KPIs) are not synonymous. Sales metrics cover a wide range of sales-related performance and activities of an individual, team or company over a period of time. They keep a finger on the pulse of a team’s activity but they don’t necessarily always relate directly to business goals. Meantime, sales KPIs are a subset of metrics that are sharply focused on performance against strategic goals.
A good way to think of it is that metrics show what is happening and KPIs show what matters. Consider revenue, for example. Sales revenue is the metric that shows what is happening. If a business seeks to boost sales by 15%, then sales growth would be the corresponding KPI that shows the revenue metric relative to the goal. In this case, additional KPIs—such as total number of deals closed or average deal size—can help explain what’s driving (or hindering) that growth.
Why Is Tracking Sales Metrics Important?
By analyzing sales metrics, sales leaders can evaluate what is and isn’t working in the sales process. Armed with this information, sales leaders can optimize their teams’ activities to improve overall sales performance. For example, if a metric shows the sales cycle is taking longer than average, a sales leader could investigate, identify, and potentially eliminate any bottlenecks causing the slowdown.
In addition, sales metrics can inform how decisions are made with sales reps, sales activities, product/service and within departments. For example, sales leaders can use these metrics to evaluate each team member’s strengths and weaknesses, or their activities to better manage processes, adjust tactics and strategies, and improve accountability for sales outcomes. Data-driven conversations with sales teams are typically more effective and have fewer disputes than those without supporting metrics.
Leading Indicators vs. Lagging Indicators
Understanding the differences between leading and lagging indicators is essential for analyzing sales metrics and using those insights to build a winning sales strategy. Leading indicators are predictive, and generally track ongoing activities or opportunities that signal where sales performance may be headed. They could include metrics such as call volume, demos scheduled, or pipeline coverage. Lagging indicators, by contrast, measure outcomes already achieved, such as win rate, average deal size, renewal rates, or deal slip rates.
Leading indicators help sales leaders forecast outcomes and identify where early interventions—like coaching or process changes—might keep deals on track. Reviewing these metrics regularly allows teams to adjust tactics before issues affect revenue. Lagging indicators, on the other hand, help leadership assess whether strategic goals have been met and what contributed to success and what didn’t. These insights can also inform broader decisions around pricing, product positioning, or resource allocation.
Organizations need a balanced combination of both types of metrics to guide their sales tactics.
What Are the Most Important Sales Metrics?
There is not a single sales metric critical for all companies, even within the same industry. Rather, a business’s chosen sales metrics depends on its goals. For example, if a business’s goal is to have every sales rep meet their quotas, then metrics that track the percentage of deals each person closes would be useful. If the organization wants to land larger deals, it might track average deal size to see whether its approach is working with larger customers. As businesses grow or branch into new markets, metrics can be added or eliminated.
Sales Metrics
While companies and sales teams will want to choose the metrics that best match their sales goals, some sales metrics are useful to most organizations. They include:
- Annual Recurring Revenue
- Average Revenue Per User
- Quota Attainment
- Win Rate
- Conversion Rate
- Sales Cycle Length
- Average Deal Size
- Average Profit Margin
- Deal Slippage
- Churn Rate
- Net Revenue Retention Percentage
- Pipeline Coverage
- Sales Productivity Metrics
- Lead Scoring
- Sales Linearity
- Average Customer Lifetime Value (CLV)
- Sales Ramp
- Renewal Rate
- Forecast Accuracy
- Number of Cross Sells and Upsells
-
Annual Recurring Revenue
Annual recurring revenue (ARR)—often used by subscription-based businesses or software-as-a-service (SaaS) models—reflects the revenue per customer for each year of a multiyear contract. Sales and finance leaders can track ARR year over year to forecast revenue and evaluate growth prospects. Companies can also analyze ARR for specific segments, such as product line, region, or type of customer (new, current, etc.), to gauge specific performance.
ARR accounts for the overall contract cost, plus upgrades, minus losses from downgrades and cancellations. It excludes one-time fees, variable fees and subscription consumption fees.
Here is the formula to calculate ARR:
Annual recurring revenue (ARR) = Total value of contract / Number of contract years
For example, the ARR for a five-year, $25,000 contract would be $5,000.
-
Average Revenue Per User/Average Revenue Per Account
Average revenue per user (ARPU), or average revenue per account (ARPA), is the amount of revenue a company generates per user or account in a given period. Like ARR, ARPU can be segmented for insights into which customer groups or regions generate more revenue and which ones need improvement.
ARPU growth over time often indicates that customers are willing to pay more for a company’s services or products. If ARPU decreases, a sales team might consider offering a higher-priced premium service or add-on that complements the existing service.
Here is the formula to calculate ARPU/ARPA:
ARPU/ARPA = Total revenue / Average number of users or accounts
For instance, if a company has $500,000 in total Q2 revenue and an average of 5,000 customers, its ARPU for the quarter is $100.
-
Quota Attainment
Quota attainment is the percentage of sales that reps close in a given period compared to their set goals, or quotas, for that time. In other words, it measures how close sales reps were to meeting their goal. Sales leaders and reps can use this metric to adjust their sales forecasts, evaluate top performers or underperformers, and modify sales approaches in order to reach targets. Quota attainment can also be used to indicate how well specific groups, or the sales organization as a whole, performed.
Here is the formula to calculate quota attainment:
Quota attainment = (Sales from actual bookings / Sales quota) x 100
For example, if a salesperson closes $35,000 in deals for a month in which $50,000 is the goal, their quota attainment is 70%.
-
Win Rate
Win rate is the percentage of the total number of quoted deals that turn into sales. It measures a sales team’s effectiveness in converting proposals into actual sales. Sales managers also can track win rates by sales rep to measure individual performance and to calculate the number of future sales opportunities required to meet targets.
Here is the formula to calculate win rate:
Win rate = (Number of wins / Number of quoted opportunities, lost and won) x 100
If a salesperson closes 10 deals out of 40 that were quoted, that means their win rate is 25%.
-
Conversion Rate
In sales, the conversion rate is the percentage of qualified leads, or potential customers, that become new, paying customers. This metric demonstrates the quality of leads and helps measure the performances of individual salespeople, sales teams, and marketing. Tracking conversion rates can help sales teams assess the effectiveness of lead-generation activities and lower customer-acquisition costs.
Here is the formula to find conversion rate:
Conversion rate = (Number of new customers / Number of qualified leads) x 100
For example, if a salesperson converts 10 out of 50 qualified leads into new customers, the conversion rate is 20%.
-
Sales Cycle Length
Sales cycle length is the amount of time, on average, it takes to complete a sale, starting from a rep’s first interaction with a potential customer to a closed sale. Sales leaders and teams can use this metric to spot possible delays in the sales cycle—which could put sales at risk—and then adjust their processes. Sales cycle length data can also help improve sales forecasting.
Here is the formula to calculate the sales cycle length:
Average sales cycle length = Total number of days to close all deals / Total number of deals
In practice, let’s say four deals close in one month. Deal A closes in 10 days, Deal B closes in 15 days, Deal C closes in 20 days and Deal D closes in 25. The total number of days to close these deals is 70. Divide 70 by the total number of deals—four—and the average sales cycle length is 17.5 days.
-
Average Deal Size
Average deal size is the average dollar amount generated per closed deal. This metric is useful for projecting sales revenue. Teams can estimate how many deals they must close to reach their monthly quota.
Average deal size also is useful for developing a sales growth plan. Sales managers can review average deal size by individual rep to identify larger deals that might require close monitoring and additional resources or to spot which sales reps would benefit from upselling guidance.
Here is the formula to calculate average deal size:
Average deal size = Total sales revenue / Total number of sales
For example, if a salesperson closes 10 sales deals for a total of $100,000, then the average deal size is $10,000.
-
Average Profit Margin
Average profit margin represents how much of overall sales revenue is converted into profit. As with other metrics, a business can measure its average profit margin by products, services and categories sold, sales territory, and salesperson.
Here is the formula to determine average profit margin:
Average profit margin = Net income (overall or for specific areas) / Net sales (overall or for specific areas) x 100
Net income is derived by subtracting a particular segment’s total expenses from its total revenue. Net sales is calculated by subtracting the segment’s total returns or refunds from total sales. If a specific sales territory generates $150,000 in net income on net sales of $500,000, then its profit margin is 30%.
-
Deal Slip Rate
Deal slippage refers to the percentage of commitment-stage deals or orders that don’t close within the forecasted range—such as if a client commits to a deal in Q3 but then defers the deal to Q4. Sales teams consider deal slippage when preparing sales forecasts.
Here is the formula to find deal slippage:
Deal slip rate = Number of deals that didn’t close / Number of deals expected to close x 100
For example, if 100 deals were in the commitment stage but 20 did not close as expected, the deal slip rate is 20%
-
Churn Rate
Churn rate is the percentage of customers who cancel or don’t renew their contracts or subscriptions for a company’s services or products. Customer churn analysis reflects a company’s ability to retain customers. Finance leaders also watch churn rates due to the potential impact on a company’s sales and profits. Rising churn rates could indicate a problem with a company’s offerings or sales approach, or it could mean the company is losing business to competitors.
Here is the formula to calculate churn rate:
Churn rate = Number of customers lost / Starting number of customers x 100
For example, if a company begins Q3 with 5,000 customers and ends Q3 with 4,000 customers, then the difference in the number of customers (1,000) indicates a 20% churn rate.
-
Net Revenue Retention Percentage
Net revenue retention represents the percentage of a company’s recurring revenue derived from its existing customer base over a given period. Typically measured by subscription-based businesses, net revenue retention factors in changes in revenue due to upgrades, downgrades, and cancellations. Sales and finance leaders use this metric to assess how well teams renew and expand revenue from their customer bases.
Here is the formula to calculate net revenue retention percentage:
Net revenue retention percentage = Renewal revenue at beginning of period + upsell revenue – churn / Renewal revenue at beginning of period x 100
For example, if a company has 300 customers that each pay $2,500 per month, its net revenue for the month is $750,000. During March, 10 customers add a $2,000 monthly upgrade (+$20,000; renewal revenue total = $770,000), 10 downgrade by $500 each ($770,00 – $5,000; renewal revenue total = $765,000), and 10 customers cancel ($765,000 – $25,000; renewal revenue total = $740,000). The net revenue retention percentage is 96.1% ($740,000/$770,000).
-
Pipeline Coverage
Pipeline coverage refers to the value of a sales rep’s potential sales opportunities relative to their quota for a given period. It is expressed as a multiple of the salesperson’s quota. If a salesperson has $300,000 of pipeline with a quota of $100,000, then they have 3X pipeline coverage. This information can help sales managers adjust tactics and strategies to meet quotas.
Here is the formula to calculate pipeline coverage:
Pipeline coverage = Potential sales in pipeline, in dollars / Sales quota, in dollars
-
Sales Productivity Metrics
Sales productivity metrics track sales team activities. Examples include the percentage of time spent on selling versus non-selling activities, daily average number of sales tools used and percentage of hot-lead follow-ups. Sales leaders use these metrics to assess team and individual sales performance and prospect engagement.
-
Lead Scoring
Lead scoring is the process of evaluating and ranking a lead based on how likely it is to turn into a sale. Lead-scoring systems assign point values to leads based on a variety of factors, such as buyer behavior, frequency of interactions, demographics, and company information. The higher the points, the better the lead. Lead qualification helps sales and marketing teams focus their efforts on promising prospects rather than those with little chance of converting.
Software and specifically CRM systems that automate lead scoring using predictive analysis remove the complexity, time commitment and chances for errors common with manual lead scoring. In addition, scoring “gets smarter” as more data becomes available.
-
Sales Linearity
Sales linearity refers to nurturing and closing deals in a predictable, steady flow rather than in a rush of sales, typically near the end of a given period. When most deals are crammed into the last few days of a period, it can negatively impact a business’s sales forecasting, resource planning, cash flow, and profit margins.
By increasing sales linearity, sales leaders can more accurately forecast sales and sales reps can better manage their pipelines to keep leads moving through the sales cycle. Greater sales linearity also helps increase cash flow and profit margins because there’s less need for last-minute discounts as a period end nears. Some sales leaders offer incentives, such as extra commission for reps or premium packages for customers, for those who close early in the quarter.
-
Average Customer Lifetime Value (CLV)
Average customer lifetime value (CLV) measures the total revenue a business expects from a typical customer over the course of their entire relationship. It reflects how good a company is at maximizing the value of each customer relationship and can help guide decisions around marketing spend, retention efforts, and customer support.
Average customer lifetime value = (Average Purchase value x Purchase Frequency) x Average customer lifespan
So, if a company finds that the average purchase value on its website is $50, that the average purchase frequency is three purchases a year, and the customer lifespan averages 2 years, then the CLV would be (50 x 3) x 2 = $300.
-
Sales Ramp
Sales ramp measures the time it takes for a new sales representative to reach full productivity after being hired. This period includes onboarding, training, and completing a full sales cycle. The shorter the ramp, the more effective a company is at getting new hires to contribute to revenue faster.
Tracking sales ramp helps businesses plan hiring and training schedules, manage team capacity, and improve revenue forecasting based on existing staff and hiring goals.
Sales Ramp = Time to complete full sales cycle + Onboarding/training time
For example, if onboarding and training take 95 days and the average sales cycle is 93 days, then ramp time would be roughly 188 days—or just over 6 months.
Some organizations take a performance-based approach to calculating sales ramp, measuring it as the time it takes a new rep to consistently reach 100% of their sales quota, including the onboarding and training period. This method reflects true ramped productivity, not just the milestone of completing a single sales cycle.
-
Renewal Rate
Renewal rate tracks the percentage of customers who choose to extend their contracts or subscriptions at the end of a term. It’s essentially the inverse of churn rate and is a vital metric for SaaS and other subscription-reliant companies. Renewal rate reflects customer retention and long-term revenue stability. Businesses can use this metric to shape retention strategies and identify product or service improvements that could reduce churn.
Renewal Rate = (Number of customer renewals / Total number of customers up for renewal) x 100
As an example, if a Saas company has 100 customers up for renewal in a certain period, and 90 of them decide to renew their subscriptions, then the renewal rate would be 90%. Oftentimes companies will use renewal rates as a leading indicator for churn—a drop in renewals can be an early warning of an impending rise in churn. Regularly monitoring this metric allows businesses to spot small fluctuations, predict potential attrition, and take proactive steps to retain more customers.
-
Forecast Accuracy
Sales forecast accuracy helps companies examine how closely actual sales match up to forecasted sales within a given time period. It gives financial and operational leaders a barometer for the confidence they can put in forecasts as they engage in financial planning, inventory management, and resource allocation. Forecast accuracy is especially useful for companies with complex sales cycles or those that serve volatile markets.
Forecast accuracy = [1 – (|Forecasted sales – actual sales| / actual sales)] x 100
For example, if a manufacturing firm forecasted $120,000 in sales for Q1, but actual sales were only $100,000, then the forecast accuracy calculation would be [1 – (|$120,000 – $100,000| / $100,000)] x 100 = 80%.
-
Upsell/Cross-Sell Rate
The number of upsells and cross-sells shows how well the sales team boosts revenue from existing customer relationships. Upselling refers to encouraging customers to purchase a higher-tier or more premium offering, while cross-selling involves promoting complementary products or services. Together, these metrics reflect how well sales strategies drive expansion within the current customer base and contribute to top-line growth.
Upsell/Cross-Sell Rate = (Additional revenue from upsells and/or cross-sells) / Total original sales revenue) x 100
If a company has $20,000 in original sales revenue and generates an additional $4,000 from upselling and cross-selling, the rate would be ($4,000 / $20,000) x 100 = 20%.
Organizations can track these metrics together, as shown here, or separate them to evaluate upselling and cross-selling performance individually.
Choosing the Right Sales Metrics to Track for Different Roles
Deciding on the “right” sales metrics to analyze depends on who is looking at them. Each stakeholder in the sales team will want to pay attention to different metrics based on their specific goals. For example, sales executives are tasked with planning out long-term sales strategies using slightly different metrics than sales managers trying to drive more rapid short-term gains. Meantime, sales operations staff will be keyed to metrics offering clues on how sales processes and supporting procedures around contracts and customer service impact revenue gains or losses.
The following are some of the most common metrics that different roles will need to watch for and an explanation of how these stakeholders can best use them.
- Sales representatives: Sales reps will want to focus on metrics that track their productivity, conversion effectiveness, and deal success. The goal of analysis is to examine these numbers in light of their activities during that same time period to determine their highest-impact actions and sales techniques. Some of the common metrics this role should watch includes win rate, average deal size, and quota attainment.
- Sales managers: Sales managers will want to pay attention sales metrics similar to those watched by their reps, though contextualized against the rest of the team’s performance. The goal for this role is to use metrics to help them identify underperformers, allocate coaching resources, and adjust strategies or quotas to boost sales output. Some of the most common metrics for this role includes pipeline coverage, deal slip, and productivity metrics like number of sales calls made, emails sent, or meetings booked.
- Sales operations: Sales operations stakeholders will use those metrics that help them streamline sales processes, improve budgeting, maintain retention, and boost pipeline predictability. As such, sales ops roles are most likely to find metrics like forecast accuracy, churn rate, and sales cycle length to be most relevant to their goals.
- Sales executives: Sales executives want to look at bigger picture trends that help them steady the course of their sales strategies and report their performance levels up to the executive suite. This means that executives are most likely examining sales KPIs for a sense of actual performance against goals. Common metrics include ARR, ARPU and ARPA, CLV, and net revenue retention.
How to Track Sales Metrics
Sales metrics change quickly and require regular monitoring for the most up-to-date analysis. Here are a half-dozen steps for tracking sales metrics:
- Select a few key sales metrics that represent the most important sales drivers for the organization.
- Decide the frequency of measuring these sales metrics. For example, pipeline coverage may be reviewed weekly or monthly while the number of sales calls is reviewed daily.
- Aggregate sales data. The most effective method is to rely on real-time reporting with CRM or sales analytics software. Consistent calculations are instrumental for accurate comparisons.
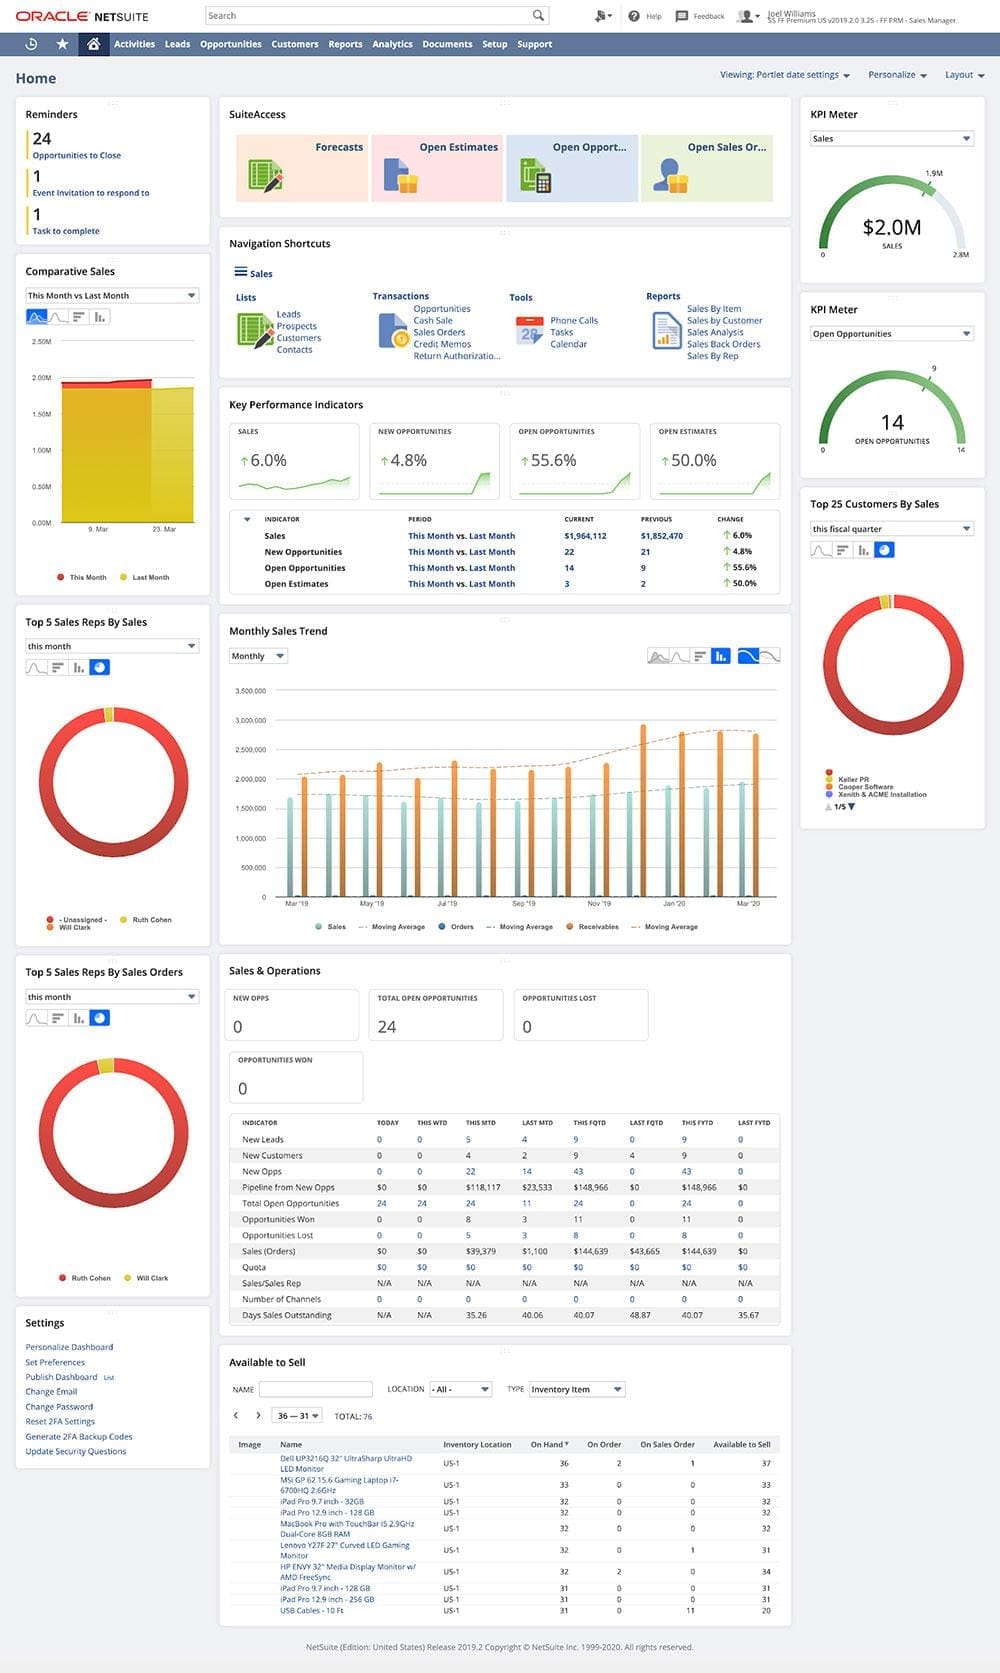
- Use data visualization tools. When presented in visual format, data is processed quickly and more efficiently, creating more of an impact on sales teams. Certain powerful CRM software provides customizable, role-based, real-time dashboards that track metrics from opportunity stage to closed sale and customer service.
- Analyze the data and look for trends. For example, is the average revenue per account increasing or decreasing month over month?
- Apply results to improve sales results. Look for areas that require improvements. If average revenue per account is decreasing, what action can the business take to stop this trend and increase revenue?
Tracking Sales Metrics With Software
A powerful solution like NetSuite CRM automates the entire lead-to-cash cycle, capturing data along the way. NetSuite provides real-time tracking of meaningful sales metrics and displays them via easy-to-understand and customizable dashboards. With the right software, sales teams can continuously monitor performance, improve sales forecasting, and adjust their approach to achieve or even exceed their sales goals.
Sales metrics are especially critical in business since sales are the primary source of the company’s revenue and profit. They can measure the performance and effectiveness of an entire sales organization, individual teams and reps, and specific products. The right mix of metrics provides a solid understanding of revenue drivers, which levers to pull to achieve sales goals, and areas that need improvement.
Sales Metrics FAQs
What are sales metrics?
Sales metrics measure the sales-related performance and activities of an individual, team or company over a period of time. They can measure a number of things related to revenue, quotas, and customer retention.
What are KPIs for sales?
Sales KPIs are specific sales metrics with a targeted goal. They are strategic and intended to drive action toward a predetermined goal.
How do you track sales metrics?
Sales metrics can be tracked manually, but the most accurate, efficient and real-time method is with software such as CRM.
What are the five most important metrics for performance of the product?
The five most important metrics for performance of a product vary by company, product and industry. The key is to identify the biggest drivers of business, product, and service success and monitor those metrics on a regular basis. Examples include revenue, profit margin, and conversion rate.