
Ecommerce businesses run on data, but making sense of it all is an ongoing challenge. Ecommerce represents a $4.3 trillion global market in retail alone, and it’s becoming an increasingly important channel for B2B sales. To compete, teams need near-instant visibility into campaign performance, inventory levels, and customer satisfaction so they can understand what’s working and quickly adjust what’s not. Ecommerce dashboards make this possible by centralizing key marketing, sales, operations, and fulfillment metrics into a single, intuitive interface—enabling tighter cross-team alignment and smarter decision-making.
What Is An Ecommerce Dashboard?
An ecommerce dashboard is an interface that automatically collects performance data for online sales channels and displays it in clear, visible formats, such as charts, graphs, and tables. Common data sources include marketing platforms, customer databases, sales systems, and inventory management tools.
Dashboards help business owners, analysts, and sales and marketing teams track conversions, revenue, and other operational trends at a glance. By centralizing data from across the business, dashboards allow users to monitor progress, identify opportunities and bottlenecks, and make well-informed decisions.
Key Takeaways
- Ecommerce dashboards quickly turn high volumes of data—drawn from sales and marketing sources, customer interactions, and backend systems—into clear, actionable insights.
- By encouraging data-driven collaboration, dashboards help ecommerce teams acquire the visibility and flexibility they need to achieve desired results.
- Effective dashboards prioritize key metrics, including total revenue, transaction volume, and average order value.
Ecommerce Dashboards Explained
Ecommerce dashboards are essential tools for tracking and managing the performance of sales, marketing, and operations. They provide timely, accurate insights that support both daily decisions and long-term planning. By unifying key data, such as financial metrics, inventory levels, and promotional campaign results, into a single interface, dashboards help teams coordinate and collaborate more effectively.
In addition to simplifying access to data, dashboards make it possible to identify trends, spot opportunities, and highlight areas in need of attention. For example, a sudden drop in conversion rate may signal a checkout issue, while a surge in sales following a marketing campaign could indicate a strategy worth expanding. With dashboards, teams can closely monitor key performance indicators (KPIs) that fuel growth—customer acquisition cost, average order value, return rates, and more—and can respond quickly to shifts in performance.
Without dashboards, ecommerce teams often must rely on the manual work of sorting through spreadsheets and calculating raw numbers, for instance. Dashboards reduce that burden by organizing and presenting data visually so users can confidently focus on what’s most needed to perform their jobs.
Why Are Ecommerce Dashboards Important?
Ecommerce dashboards shine because they help make sense of the massive amount of data generated by marketing, sales, customer interactions, supply chain systems, and other sources. A centralized, real-time view of this information helps keep teams focused and agile while reducing time spent on manual data collection and analysis.
Customer data, such as browsing behavior, purchase history, and engagement trends, can be analyzed to segment audiences and tailor campaigns to promote sales. By quickly spotting patterns, teams can adjust strategies to attract new buyers and improve retention, leading to higher conversion rates and customer satisfaction.
Dashboards can also increase efficiency in sales and inventory management. Instead of relying on static reports or gut feelings, business leaders can use up-to-date data to guide their decisions. Sales dashboards, for example, help teams identify underperforming products or campaigns, which amplifies effective resource allocation. Inventory dashboards can flag low-stock items, highlight costly stockouts, and support accurate demand forecasting. Armed with such insights, ecommerce businesses will be in a better position to reduce costs, improve fulfillment speed, and consistently meet—or exceed—customer expectations.
Benefits of Leveraging Ecommerce Dashboards
Ecommerce businesses deal with constant change, including shifts in customer demand, rising ad costs, supply chain delays, and fast-moving competitors. Dashboards can help cut through the disarray by providing clarity and agility across all areas of an ecommerce business from warehouse to website. Here are some of the ways they enhance performance, collaboration, and customer satisfaction:
- Data-driven decision-making: Dashboards consolidate data from multiple sources into a single interface, making it easier to identify trends and anomalies as they emerge. A shared, real-time view of key metrics reveals what’s working, while alerts can flag underperformance so teams can adjust strategies accordingly. Tracking pertinent KPIs means everyone will measure success the same way, which supports fact-based decisions.
- Stronger collaboration: Dashboards break down silos by giving all departments shared access to the same information. This alignment can make cross-team workflows run more smoothly, reduce miscommunication and conflicts, and create a culture of accountability and trust.
- Increased inventory control: Dashboards improve inventory control by combining stock levels, reorder points, and supplier lead times with sales and marketing data. This supports more accurate demand forecasting and avoids overstocking and its associated carrying costs. Meanwhile, automated low-stock alerts can help prevent stockouts that would interfere with smooth order fulfillment.
- Improved performance insights: Up-to-date access to conversion rates, AOV, CAC, and other metrics means ecommerce teams will be able to monitor campaign performance and spot sales funnel bottlenecks. As a result, they can refine targets, adjust messaging, and respond to market changes before performance drops or revenue is affected.
- Centralized data and analytics: Automatically aggregating data from sales, marketing, logistics, and customer service cuts down on manual reporting and lowers the risk of errors. With all key metrics shown in one place, teams can quickly identify patterns, compare performance across functions, and get a clearer view of overall ecommerce performance.
- Time savings: Automated data collection and analysis frees teams from hours of data entry, spreadsheet management, and number crunching. A sales manager, for example, would be able to check stock levels and channel profitability without querying multiple systems or calculating metrics by hand. With more time available for developing and executing strategies, teams can work more efficiently.
- Higher customer satisfaction: With quick access to important metrics, such as net promoter scores and return rates, businesses can spot and address problems, like a spike in returns on the heels of a product launch. At the same time, visibility into in-depth customer data often facilitates more personalized shopping experiences, which can strengthen buyers’ loyalty and improve retention.
Ecommerce Dashboard Features
The value of an ecommerce dashboard depends on the features it offers—and on how well those features meet your business needs. Beyond displaying key business metrics, a useful dashboard should be flexible enough to accommodate your workflows, intuitive enough for any team member to use, and powerful enough to disclose data that matters most, without added complexity. The capabilities described below reflect those qualities; considered together, they define the sought-after elements of an effective ecommerce dashboard:
- Real-time tracking: Direct connection to live data sources means metrics will reflect the current state of the business. Early detection of trends, such as inventory shortages, unusual drops in conversion rates, or fulfillment delays, allows teams to react before issues hurt revenue. Real-time, automated alerts and order tracking help teams reduce customer inquiries by making key information accessible before issues escalate.
- Configurability: Dashboards with flexible layouts, customizable KPIs, and modular templates can adapt to the unique needs of marketing, sales, logistics, and executive teams. Role-based access allows each user to see the most relevant information for their function, without extraneous content. Configurable dashboards also help track new metrics or integrate additional data sources as business priorities evolve, without disrupting existing workflows.
- Data visualization: Clear, intuitive visual elements like charts, graphs, heat maps, and key data points make complex data easier to interpret and act on. Even non-data analysts will find they can detect patterns, outliers, and shifts in performance that might otherwise go unobserved, enabling faster and more confident decision-making.
- Data integration: Connecting ecommerce platforms, CRM systems, and supply chain tools merges key data into a single, unified dashboard. This keeps metrics up to date and eliminates the need to switch from one system to another. Scalable integration—through APIs, native connectors, or third-party services—helps maintain visibility and control as ecommerce businesses expand into new channels and markets, and as operations grow more complex.
Ecommerce Dashboard Key Metrics
Dashboards are most effective when they highlight a focused set of metrics that reflects performance across sales, marketing, operations, and customer experience. Here are some key ecommerce metrics to track in these four areas:
-
Sales metrics give a snapshot of financial health, purchasing behavior, and product demand:
- Total revenue reflects overall income from purchases.
- Transaction volume shows how many orders are being placed.
- Average order value (AOV) reveals the typical spend per transaction.
-
Marketing metrics indicate the financial success of campaigns and can help teams improve the customer journey:
- Bounce rate tracks the percentage of website visitors who leave without engagement.
- Conversion rate measures how many visitors complete a desired action, such as turning into buyers.
- Return on ad spend (ROAS) measures the revenue generated by every dollar invested in a campaign.
-
Operational metrics can support inventory planning, fulfillment, and customer satisfaction:
- Stock levels show current inventory status.
- Turnover rate measures how quickly products sell through.
- Delivery times reflect shipping performance and reliability.
- Net promoter score measures overall brand loyalty and the likelihood of customer recommendations.
-
Customer experience metrics are essential for understanding acquisition and retention:
- Customer acquisition cost (CAC) shows how much is spent to acquire each new customer.
- Customer lifetime value (CLV) estimates the total revenue expected from a single customer over time.
- Repeat purchase rates reveal how often customers return to buy again.
- Cart abandonment rates show the percentage of customers who add items to their cart but don’t complete the purchase.
Types of Ecommerce Dashboards
A single dashboard can provide high-level visibility, but ecommerce businesses can get more out of their data by relying on a set of dashboards tailored to specific functions. By organizing metrics according to roles and goals—such as web traffic, sales, supply chain, and inventory—dashboards present information that matters most to the users who need it most.
Here are several common types of dashboards ecommerce companies use to support their business goals.
Web Traffic Dashboard
Web traffic dashboards help marketing and growth teams get a sense of how visitors find and interact with an ecommerce site by tracking website visits, session duration, bounce rate, and other metrics. They also inform improvements to content, user experience, and acquisition strategies.
Segmenting traffic by source (organic search, paid ads, social media, and so on) highlights which channels and campaigns yield the best results. When integrated with sales funnel data, traffic dashboards provide details on where visitors drop off—and why. Technical KPIs, such as page load time and error rate, can help teams optimize site performance and user experience, while real-time monitoring and alerts facilitate quick responses to unexpected traffic spikes or disruptions.
Ecommerce Sales Dashboard
Designed for ecommerce managers, marketers, and finance teams, an ecommerce sales dashboard monitors revenue performance and customer behavior. It automates reporting to keep teams aligned on revenue trends, product performance, and customer buying behavior. It usually tracks sales by day, week, month, or quarter, and monitors top-selling products and metrics like AOV and profit margins to provide a snapshot of business health.
Users can apply filters that drill down to determine which channels (website, marketplaces, social media, etc.) generate the most revenue, which is helpful when developing marketing and inventory management strategies. Customer segmentation can be used to distinguish among new, repeat, and loyal buyers, an aid when targeting retention and upsell strategies.
Gross margin, cost of goods sold, and other profitability metrics go beyond top-line sales to dig deeper into overall financial health.
Supply Chain Dashboard
A supply chain dashboard gives operations and logistics teams a look at the movement of goods and the performance of suppliers. It’s used to monitor fulfillment efficiency, spot disruptions early, and support more reliable delivery.
KPIs, such as supplier lead times, delivery accuracy, and defect rates, highlight ecommerce fulfillment performance at a glance, while shipping accuracy and cycle time can spot bottlenecks and unnecessary steps that inflate fulfillment costs and impede delivery. These dashboards may also include views of inventory in transit, and they can trigger alerts for delays, shortages, or cost overruns, including unexpected increases in shipping fees, supplier charges, or storage costs that exceed budgeted allowances.
Additionally, by tracking supplier performance trends over time, supply chain dashboards can help businesses identify dependable partners and address recurring issues, such as frequent late shipments from a particular vendor. This degree of end-to-end visibility can support better partner negotiations, minimize supply chain disruptions, and accelerate delivery times.
Inventory Dashboard
An inventory dashboard helps operations, logistics, and purchasing teams monitor stock availability and fulfillment readiness. It provides a clear view of stock levels, reorder points, and inventory health across locations.
The dashboard tracks turnover rates, aging inventory, and number of days of stock on hand to prevent either overstocking or stockouts. Automated reorder thresholds can trigger purchase orders as inventory runs low, minimizing delays and manual oversight. For businesses managing multiple warehouses, inventory dashboards can be segmented regionally to facilitate faster delivery and lower shipping costs.
It can also monitor returns, shrinkage, and damaged goods to offer a more complete view of inventory health. Combined with data on carrying costs and landed costs (that is, the total cost of a product, including shipping, taxes, and fees), these dashboards can accelerate better pricing and purchasing decisions.
Best Practices for Creating Ecommerce Dashboards
Ecommerce is a fast-paced industry, marked by dynamic sales channels, complex supply chains, and quickly shifting customer expectations—so dashboards need to do more than simply display data. The most effective ones are designed with intention: They surface relevant metrics, deliver timely alerts, are intuitive to use, and can adapt as business needs evolve.
The following best practices can help ecommerce businesses build accurate, actionable dashboards that help them adapt to emerging trends as they continue to hone their sales, marketing, and operations strategies:
-
Set Up Real-Time Alerts
Real-time alerts enable teams to act quickly to prevent minor issues from escalating into major problems. The alerts enhance visibility, reduce the need to constantly check dashboards, and strengthen operational controls.
Use threshold-based alerts to trigger notifications when KPIs hit specific, predetermined criteria. Consider artificial intelligence (AI)-driven alerts to detect subtle anomalies that static, threshold-based rules might miss, such as an unusual drop in conversion rate that stays above your preset threshold but breaks from recent trends.
To avoid alert fatigue, group related alerts and apply escalation rules so teams stay focused on addressing critical problems. Deliver alerts through existing channels—email, SMS, in-app messages, or collaboration tools, such as Slack and Microsoft Teams—so they reach the right users at the right time. And don’t forget to periodically review and adjust settings to keep pace with business goals.
-
Avoid Overloading Dashboards
Cluttered dashboards make it harder to find key information and hinder quick decision-making. Keep layouts clean by limiting the number of metrics presented and avoid including redundant or low-priority data.
Assign one widget per metric and organize them logically. Prioritize the most important metrics with prominent dashboard placement, larger font sizes, or strategic color-coding. Use clear labels, give each widget space, and group related KPIs by role or team. Tabs or collapsible sections can help decrease visual “noise” and simplify dashboard navigation.
Prebuilt dashboards provide a fast, low-effort starting point featuring automated data aggregation and standardized templates that cover common use cases. Custom dashboards, while more resource-intensive, offer greater flexibility, allowing teams to tailor visualizations and filters to suit their preferred workflows. Always test dashboards with real users and iterate based on feedback to keep designs aligned with day-to-day needs.
-
Set Benchmarks and Goals
Dashboards are most useful when they track progress against clear, measurable benchmarks and goals. Collaborate with stakeholders from various departments to define business objectives and translate them into specific KPIs or performance thresholds.
Benchmarks should be realistic, yet challenging, motivating teams to improve without setting them up to fail. Make goals visible within the dashboard to reinforce priorities and keep everyone working toward the same shared goals. Linking team-level metrics to broader company objectives can spur employee engagement and strengthen accountability.
-
Identify and Prioritize Key Metrics
After setting benchmarks and goals, identify the metrics that directly support them. Strategic planning frameworks, such as balanced scorecard or Objectives and Key Results, can help teams determine which KPIs are most relevant to desired business outcomes.
Instead of tracking data for its own sake, each metric on the dashboard should directly inform decisions or prompt specific actions. Connect dashboards to real-time data sources, including ecommerce and social media platforms, website analytics tools, and CRM systems, to keep KPIs accurate, up to date, and actionable.
-
Use Data Visualization Wisely
The goal of data visualization is to make information easier to interpret and act upon. This helps teams identify patterns, monitor changes, and successfully grasp otherwise complex information.
Choose the right format for different data sets—line charts work well for showing trends over time, while bar charts are better choices for comparisons. Avoid cluttering dashboards with large tables and overly complex visualizations, such as 3D charts, as they can obscure insights.
Use consistent colors, clear labels, and interactive filters so users can explore data and drill down into granular insights. Visual cues, such as icons and progress bars, can highlight important changes and complement alerts that require immediate attention.
-
Customize Dashboards for Specific Teams
Custom dashboards aimed at specific departments or roles give users direct access to the information they need to do their jobs. Role-based views show only the data relevant to each team’s responsibilities, reducing distractions and promoting a sense of ownership and accountability.
User-level customization, such as layout preferences and filter options, lets individuals personalize their dashboards without affecting others or compromising data integrity. Mobile-responsive designs extend this accessibility, allowing managers and field teams to retrieve critical information and make timely decisions from any location.
It’s also wise to provide training or onboarding so all users can successfully navigate their dashboard, interpret data, and use customization features. Together, these practices help improve usability, drive internal adoption, and foster a strong and data-driven culture.
-
Regularly Review and Assess Dashboard Effectiveness
Monthly or quarterly reviews are advisable to verify that dashboards display the information necessary to support business goals. Revisit benchmarks, goals, and KPIs to confirm that they reflect current priorities—and that the dashboard continues to visualize needed data clearly and effectively.
As teams reach milestones, market conditions shift, or business priorities evolve, these regular assessments will keep dashboards relevant and actionable. Collect and analyze user feedback to identify data gaps, uncover usability issues, and solicit suggestions for functionality improvements. Monitor dashboard performance and accuracy by tracking load times and error rates, especially when integrating multiple sources.
NetSuite SuiteCommerce Is an All-in-One Solution
Managing an ecommerce business demands seamless coordination across a variety of functions from sales, marketing, and inventory to customer experience. As operations grow, the need for unified dashboards, timely data, inventory control, and actionable insights becomes even more critical. Yet, many businesses struggle with siloed platforms and manual data transfers that can lead to errors, inefficiencies, and missed opportunities.
NetSuite SuiteCommerce helps ecommerce businesses make data-driven decisions and deliver a consistent customer experience through its single, cloud-based platform. It connects ecommerce with core business functions, such as order and inventory management, CRM, marketing, and financials—reducing reliance on fragmented tools and manual data transfers. Data is shared across every department in real time, giving teams a unified view of performance, customer activity, and stock levels.
SuiteCommerce also supports personalized shopping experiences, built-in analytics, and workflow automation, helping both B2B and B2C ecommerce companies streamline operations and scale with confidence.
SuiteCommerce Performance Dashboard
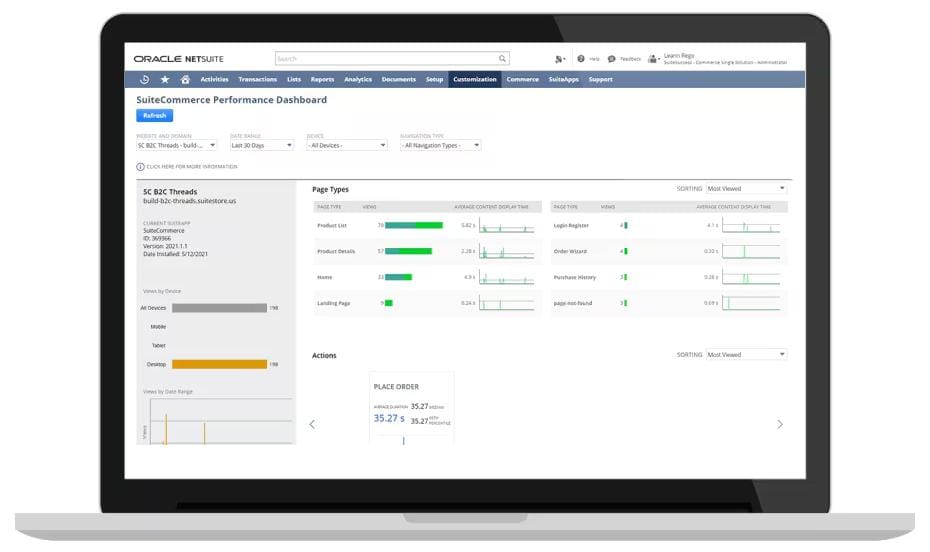
Dashboards give ecommerce businesses the clarity and speed they need to reach informed decisions in a fast-moving industry. Unified, visual performance data helps teams stay agile, address issues early, double down on what’s working, and rethink what’s not. As ecommerce continues to evolve, dashboards are likely to play an even greater role in helping brands adapt, compete, and grow with confidence.
Ecommerce Dashboard FAQs
What makes an effective ecommerce dashboard?
An effective ecommerce dashboard centralizes real-time data from multiple sources, uses clear visualizations to highlight key metrics, and is customizable to match the needs of different teams. It should be easy to interpret at a glance, regularly updated, and focused on insights that drive business growth. The goal is to facilitate fast, data-driven decisions and cross-team collaboration.
What are three essential KPIs that need to be included in an ecommerce dashboard?
Three essential KPIs to include in an ecommerce dashboard are:
- Total revenue, which tracks overall sales performance
- Conversion rate, which measures how many site visits turn into sales
- Customer acquisition cost, which conveys how efficiently marketing spend adds new customers
What’s the difference between a dashboard and a report?
The difference between a dashboard and a report is that a dashboard provides a real-time visual summary of the most important metrics on a single screen, while a report is typically text-based and more detailed. Dashboards allow users to monitor performance, identify key trends, and spot issues at a glance. Reports present historical data and analysis, often alongside recommendations and a deeper, more contextual narrative.