
This guide includes the formulas and elements you need to calculate recruitment metrics and improve human capital management (HCM) strategies. We’ve also included examples of the essential metrics for 2021 and how to align recruitment data to business strategy.
In this article:
- How to calculate common recruitment metrics
- Top recruiting metrics to watch in 2021
- Tips for measuring recruitment effectiveness
- The secret to linking recruitment metrics to business objectives and outcomes
What Are Recruiting Metrics?
Recruiting metrics are used to evaluate your recruiting process, how it’s performing and show a return on investment (ROI). These metrics are vital to data-driven HCM strategies and help you gauge the quality of your hires, among other important measures of success.
The recruiting process lifecycle includes sourcing, engaging, screening, interviewing, hiring, onboarding and retaining employees. An applicant tracking system (ATS) or an integrated suite of software applications known as a human resources management system (HRMS) collects, processes and organizes data about that lifecycle.
How are recruitment metrics calculated and who should be tracking recruiting metrics?
Large HR departments, recruiting professionals and talent acquisition teams are typically responsible for tracking corporate recruiting metrics. Modern HRMS platforms help make the administrative tasks associated with gathering, processing and managing recruitment metrics simpler and easier to access. Small and medium-sized businesses that lack designated talent acquisition resources can use an HRMS platform to track recruiting metrics and implement data-driven recruitment.
Recruiting Metrics vs. KPIs
Metrics are a way to measure results and are usually expressed with data. For example, a metric could simply be how many applications you received for each job opening. Key performance indicators (KPIs) are metrics tied to recruiting objectives. By definition, KPIs are key measures for your business to track. You can decide which metrics are the most important for you, your team and your business.
Key Takeaways:
- Recruiting costs are a significant human capital management expense.
- Aligning the top recruitment metrics with strategic business outcomes can highlight ROI, reveal cost inefficiencies and drive proactive workforce planning.
- Recruitment metrics are vital for assessing how your recruiting process stacks up to current hiring trends and competitors.
- Metrics are useful tools for evaluating your recruitment process. And feedback gleaned from candidates and hiring managers can pinpoint the types of changes you need to make to be successful.
Common Recruitment Metrics
Why are recruitment metrics important? Knowing how to calculate and track standard recruiting metrics helps evaluate and demonstrate ROI for your hiring activities. Here are some metrics for your recruiting efforts.
Time to Fill
This metric looks at how many days pass from the time a job is posted to when a candidate accepts an offer.
Time to fill = # of days job positions are open / total # of job positions open
For example, if you fill three positions and they took 20, 40 and 60 days to fill, your time to fill is 20+40+60/3 = 40 days. The average time to fill varies by industry but you might typically look at ranges from 35-45 days.
Improving the time to fill performance creates a competitive recruiting advantage because quality candidates are often hired quickly. A high performing and efficient recruiting team will keep the time to fill at a minimum. And understanding this metric can help with accurate workforce planning—if you need to make new hires for new expansion, for example, you’ll better understand when to start the process.
Time to Hire
Time to hire is similar to the time to fill metric. Except this metric measures from when the job is posted to the candidate’s first day on the job. And like the time to fill, this is a good measure to understand the efficiency of your recruitment funnel or talent pipeline.
Time to hire = # of days elapsed from time job is posted to first day on the job
You can calculate the time to hire for a single position, or like the time to fill, you can average it out across multiple hires.
Time in Each Recruiting Process Step
For the typical hiring process, there are various stages. They include:
- Application
- Screening
- Interview
- Assessment
- Reference check
- Final offer, contract and negotiations
By breaking down how long applicants usually spend in each of the different stages, you can find areas for improvement. For example, if the interview stage is taking too much time due to schedule conflicts, you can look at deploying video interviews or taking other action to improve efficiency. Perform this same formula for each step in the process. We’ll use the screening step for an example.
Time for recruiting process step (e.g., screening) = Total number of days to screen all applicants for all open positions in a given time / number of open positions in the same time
Offer Acceptance Rate
Offer acceptance rate measures the percentage of candidates that accept job offers. This metric is a useful gauge for competitive recruiting strategies and compensation plans.
Offer acceptance rate = # of offers made / # of offers accepted
A low offer acceptance rate might indicate a flawed compensation plan or the need to set compensation expectations earlier in the recruiting process. Measuring first offer acceptance rates to subsequent offer rates will also provide new insights into your recruitment closing process.
Source of Hire
Source of hire measures where your candidates originate. Sources include career sites, job boards, social networks, job fairs, agencies, employee referrals or intranet sites. Track this metric to find the best sources for your company, as well as specific teams and positions. Allocate resources accordingly to maximize the impact of your spending.
First-Year Attrition Rate
Examine the attrition rate of first-year employees. If there is high turnover in the first year, one contributing factor could be that you’re not finding the right candidate for the position and your recruitment needs adjustment.
First-year attrition rate = (# of first-year employees who leave the company / total # of employees who leave during the same period) x 100
A high attrition rate is costly. If you find a need for improved employee retention, try enhancing your job descriptions, the interview process and reference checks for opportunities.
Quality of Hire
Quality of hire measures the value that new employees provide based on productivity KPIs and other indicators, such as performance appraisals, employee engagement, cultural fit and management satisfaction ratings.
These metrics come from surveys and quantifiable data like sales quotas, salary data and others like retention rates. Decide how you’ll measure the quality of hire that makes sense for your business and team and track that selection of metrics. Whenever possible, align hiring objectives with business goals. A couple examples would be improving retention or prioritizing hiring that matches specific business goals—such as expanding your salesforce or making a few key hires for impactful roles.
Hiring Manager Satisfaction
Hiring manager satisfaction uses surveys to measure the quality of hire and if the recruiting process meets their needs and objectives.
There are several methods and types of satisfaction surveys available and people management platforms can automate the survey process (for example, 90 days after hire). It’s best to use a comprehensive survey with questions that address productivity, employee engagement, culture fit, skills and customer service. Absent a more sophisticated tool, a satisfaction survey simply asking if hiring managers are pleased with the pool of candidates made available to them after the screening process can be useful.
Hiring manager satisfaction rating = (# of hiring managers who are very or extremely satisfied with the pool of candidates / total number of surveys filled out) X 100
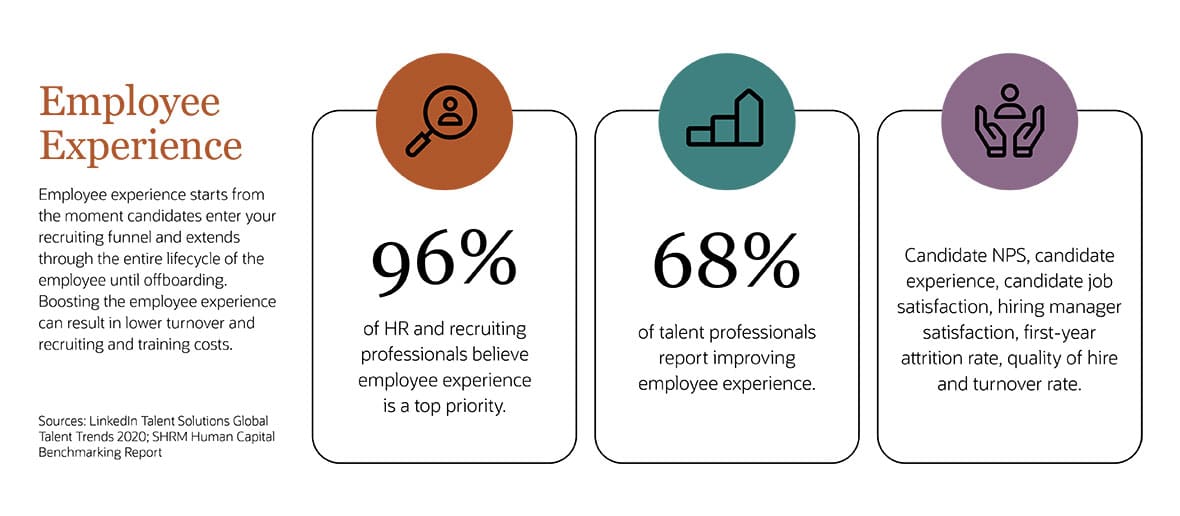
Candidate Job Satisfaction
Candidate job satisfaction uses survey feedback to measure a new hire’s job satisfaction. Use this metric to evaluate how the candidate feels about company culture, benefits, job responsibilities and the recruiting process.
Use comprehensive job satisfaction surveys periodically. For example, you may want to send out a survey after 30 days of employment and again after six months. Include questions specific to recruiting in your 30-day survey to gather data on how candidates feel about the application, interviews and onboarding activities.
These surveys can be administered through HRMS platforms that provide data visualization and reporting features. Companies that implement advanced HRMS software often report greater efficiency and engagement, leading to higher candidate job satisfaction.
Candidate job satisfaction = (# of employees who report being very or extremely satisfied with the recruiting process / total number of surveys filled out) X 100
Candidate Net Promoter Score
Candidate net promoter score (NPS) is another way to look at how your candidates view the hiring process. Use this metric to assess how likely they are to recommend another person for a job at your company based on their recruiting experience.
Ask this question to determine the candidate’s net promoter score: “On a scale of 1-10, how likely are you to recommend (your company) to a friend or colleague?”
Next, subtract the percentage of 1-6 (detractors) responses from the percentage of 9 or 10 (promoters) responses. Answers of 7 or 8 are passive and therefore not included in the calculation. The candidate’s net promoter score will be a whole number and range from -100 to +100.
To benchmark, a net positive score is considered good and scores of 50% or more are excellent. You’ll want to gather the data at various stages of the recruiting process (after interview rounds or after rejecting a candidate for employment). Then, benchmark results against competitors and internally for recruiters, departments and managers based on different roles.
Candidate net promoter score = % of promoters – % of detractors
Applicants Per Opening
Applicants per opening measures the number of people applying for your open positions. Use this metric to evaluate the popularity of a job posting or a hiring source’s effectiveness.
Applicants per opening = # of jobs posted / # of applicants
Interview to Hire Ratio
This ratio measures how many applicants hiring managers interview per posting. Use the metric to assess the efficiency of the recruiting funnel and how well it identifies quality candidates.
Interview to hire ratio = # of interviews conducted by hiring manager / vacant positions filled
The benchmark for the interview to hire ratio is three applicants to one job offer. The interview stage is often the most time- and resource-intensive phase of the recruiting process. A healthy interview to hire ratio indicates reliable sourcing and screening, as well as a quality interview process. Having three strong candidates per job offer helps hiring managers determine the best applicant without overwhelming the decision-making process.
Selection Ratio
Also known as the submittals to hire, this ratio is a measure of the total number of applicants per job opening.
Selection ratio = # of hires / total # of applicants
A lower the rate is usually better, as it indicates a selective recruiting and hiring process. The number also shows a healthy supply of applicants and possibly high demand for the job or the company’s overall employer brand. A higher ratio might indicate a small pool of qualified applicants or a highly competitive talent market for that job.
Cost per Hire
Cost per hire, also known as cost to fill, measures the expenses incurred to fill one job opening. It can be used to justify retention efforts and lowering your cost per hire is a good way to demonstrate improved recruitment processes and how they tie to business objectives.
Internal Recruiting Costs
Calculating cost per hire requires collecting and reporting accurate internal and external recruiting expenditures. Internal recruiting costs include salaries, commissions, recruiting expenses, technology and infrastructure.
External Recruiting Costs
External costs include staffing agencies, advertising, recruiting events and travel costs.
Cost Per Hire by Category
The average cost per hire varies by industry, department and job type. Industry benchmarks report a range of $3,000-$4,500 cost per hire. This metric varies by position (e.g., engineers vs. marketers), leadership role (e.g., executive management vs. frontline management) and the source of hire (e.g., online job site vs. internal referral).
Cost per hire = total recruiting cost (internal + external) / # of total hires
Sourcing Channel Cost
Sourcing channel cost measures the cost of posting and advertising open positions on online job boards. By comparing the cost to the number and quality of applicants, you can refine and focus your spending to lower costs and improve your applicant pool.
Sourcing channel cost = Advertising and posting expense per channel / # of applicants per channel
Sourcing Channel Effectiveness
How strong is your sourcing channel strategy? Dig into the quality of candidates that come from your sourcing channels. Start by tracking the most qualified candidates over a period of time and how they entered the recruitment funnel. Did they apply for the job after seeing it on a specific job board? Compare the results of different channels to find the most efficient way to prioritize your budget.
Defining a qualified candidate can be tricky, one way to simplify that is to track the number of candidates who make it through the screening process and are reviewed by the hiring manager. This is particularly useful if your hiring managers report a high satisfaction rate. You can also track the number of hires from each sourcing channel.
Effectiveness for a specific sourcing channel = # of qualified candidates generated by that sourcing channel / number of qualified candidates overall
Or to measure it by the number hires, follow this formula. If you don’t make many hires in a year or other specific time period, this information may not be very insightful.
Effectiveness for a specific sourcing channel = # of hires found by that sourcing channel / number of hires overall
Segment the different sourcing channels by internal vs. external and track channel cost and effectiveness. Review channel analytics data annually and incorporate the results in your recruiting process planning.
Candidate Experience
Get feedback from candidates at different stages. You may find you get more honest or insightful feedback from candidates who don’t ultimately receive offers than those who end up being hired. Use surveys to ask about specific stages. For example, asking about the application process could lead to revamping the application portal or making it mobile friendly. And ask either a 1-10 rating or a generic Likert scale to see how satisfied candidates are with the experience.
Especially in competitive markets or for positions with high turnover, improving candidate experience can keep qualified and talented applicants in the recruiting pipeline.
Candidate satisfaction = (# of applicants who report being very or extremely satisfied with the application process / total number of surveys filled out) X 100
Application Drop Off Rate
The application drop off rate measures the number of online applicants that fail to complete the application process.
Some online career sites offer integration between their systems and yours so the application information is automatically imported into your ATS or human resource management system (HRMS) so you have all the data you need for this and other metrics at your fingertips. This can be expressed as a ratio, such as 90 applications started and 10 finished, so a drop off ratio of 9:1.
Application drop off ratio = # number of applications started: # of applications finished
Application Completion Rate
Another way of measuring the application drop off rate is to express the same information with a percentage. To boost your completion rate, make it easy to apply with a mobile device, eliminate jargon and capture only critical screening and contact information during this initial phase.
Application completion rate = (Total number of completed applications / total number of candidates who started an application, whether they finished it or not) X 100
Percentage of Open Positions
This is a basic measure of how many open positions you have in relation to how many people you employ. If you have a high percentage of open positions, it may be an indicator of a few common issues:
- High demand for these roles
- Low supply of labor
- High employee turnover at your company
- Your company is growing rapidly
Try to notice trends like seasonality. Larger organizations can use this metric to segment by department, location or specific types of positions, e.g., salespeople or customer service agents.
Percentage of open positions = (# of open positions / # of existing positions) x 100
Recruitment Funnel Effectiveness
There are many recruitment measures to choose from. So, what are good recruiting metrics? The best recruiting metrics showcase how your hiring activities are impacting your business’s bottom line, and your recruitment funnel is pivotal for efficient and cost-effective hiring. A recruitment funnel encompasses all the efforts you take to fill vacant positions, such as job postings, building your brand as an attractive workplace, finding passive candidates and staying in touch with potential recruits. Your talent pipeline can also focus on particularly hard to fill roles such as finance team roles or sales force.
Identify the different steps in your recruitment funnel and track the efficacy of each step. This metric is expressed with a ratio for each step. For example, you may decide on the following steps in your recruitment funnel:
- Candidate screening by recruiter
- Hiring manager interviews
- Team/final interviews
- Offers
It may result in a recruitment funnel effectiveness that follows this format:
Candidate screening
350 people apply and 50 are screened by recruiter = 7:1 candidate screening ratio
Screening to hiring manager submission
50 candidates are screened, and 10 are submitted to the hiring manager = 5:1 screening to hiring manager submission
Hiring manager interviews
Of the 10 candidates the hiring manager receives, the hiring manager interviews 5 applicants = 2:1 hiring manager interview per submission
Final interviews
Of the 5 candidates initially interviewed by the hiring manager, 2 move to the final interview = 5:2
Offer to hire
One offer is made and it’s accepted = 1:1 offer to hire
Recruiting Funnel Conversion Rates
Similar to the recruitment funnel effectiveness, this metric looks at the percentage of candidates who complete the different stages in the hiring funnel. For example, the percentage of total applicants who are screened, or who are submitted to the hiring manager.
Recruiting funnel conversion rate = % of desired actions completed (e.g., applicants who are screened) / # of applicants at this specific stage
Following the same example for hiring stages as above:
Candidate screening
350 people apply and 50 are screened by recruiter = 14% of applicants are screened
Screening to hiring manager submission
50 candidates are screened, and 10 are submitted to the hiring manager = 20% of screened candidates are submitted to the hiring manager
Hiring manager interviews
Of the 10 candidates the hiring manager receives, the hiring manager interviews 5 applicants = 50% of the submitted candidates are interviewed by the hiring manager
Final interviews
Of the 5 candidates initially interviewed by the hiring manager, 2 move to the final interview = 40% of initial interviewees move to the final interview stage
Offer to hire
One offer is made and it’s accepted = 100% of offers are accepted
Automating the recruiting process can improve the number of candidates that complete each step. For example, automated calendar scheduling sends an email with a range of dates and times. The candidate selects a slot for their screening interview and appointment details are automatically sent, making it easier for the candidate and the hiring manager.
Cost of Getting to Optimum Productivity Level (OPL)
Hiring and training new employees is costly. Keep track of this measure to try and lower this over time, as well as to justify retention efforts. This measure looks at all recruiting and training costs, including the compensation for recruiters, HR team members and the training costs for the new hire. Here are a few of the recruiting costs to include:
- Posting and advertising
- Agency or recruiter fees
- Finders fees
- Background checks
- Drug tests
- Time spent screening and interviewing
- Lost sales/opportunities while position remains unfilled
- Lower productivity of new hire
- Possible client loss
- Training costs
- Hourly rate of employees who train the new employee x the number of hours spent training
Cost of optimum productivity level = Cost of recruiting + cost of training
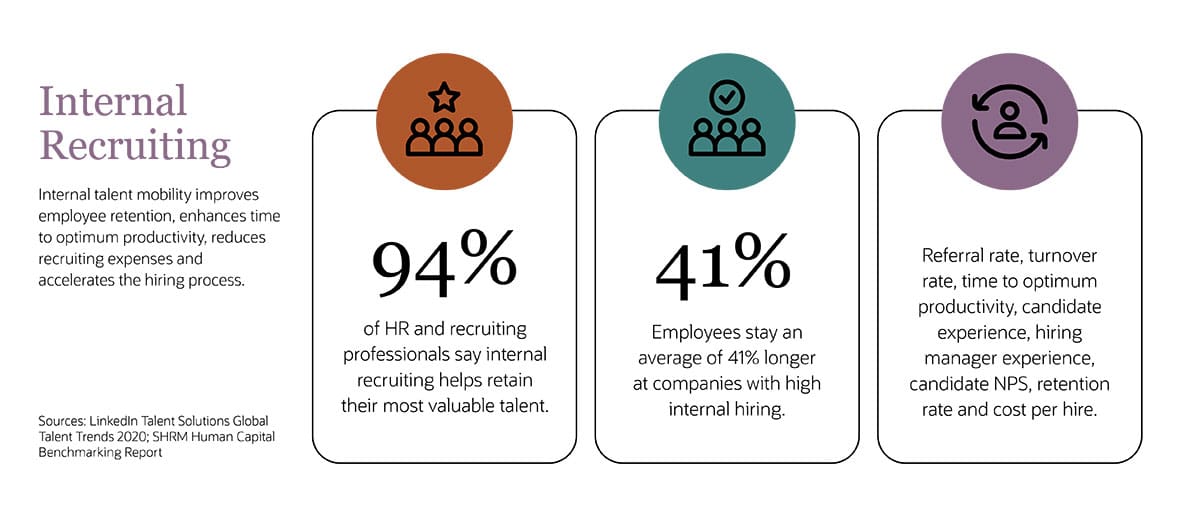
Time to Optimum Productivity
Time to optimum productivity measures how many days from the hire date it takes to bring a new employee up to speed. Use this metric to assess the effectiveness of screening, interviewing, onboarding and training.
Time to optimum productivity = # of days to recruit or hire new employee + # onboarding days + # of training days
This recruitment metric requires quantitative and qualitative data. Use feedback surveys from management and employees to gauge competency and define productivity. How long it takes for a new hire to reach optimal productivity varies by person and position, but as you collect more data, you should be able to start making some predictions. A large variance in this metric across different departments may indicate ineffective or unstructured onboarding and training or issues with how you’re measuring and evaluating applicants.
Referral Rate
Referral rate measures the number of new hires that originate from employee referrals. This metric is useful for determining the performance of internal engagement programs. It also gives you insight to how your employees view their workplace—if they’re satisfied and engaged, they’re more likely to recommend it to others.
Referral rate = # hires from referrals in a given period / # of hires in the same period
Employee referral programs can lead to higher employee retention and lower recruiting costs. Low referral rates might indicate a weak employer brand or lack of incentives for employees to engage with the recruiting process. Candidates from a referral are three times more likely to be hired and can save thousands in recruiting expenses.
Turnover Rate
This metric is also a good example of how recruiting can tie into overall business objectives. A high turnover rate increases recruiting costs. Whether employees leave voluntarily or because they aren’t the right fit for the job and are let go, recruiting can impact the turnover rate by finding the right candidate that has the experience and fits well with the company culture. The turnover rate can also be used to justify employee retention efforts.
Turnover rate = (# of employee separations during the selected period / (total # of employees at the start of the selected period + number of employees at the end of the period/2)) x 100
It’s good practice to measure the turnover rate annually, and some larger companies may choose to track it more frequently.
Most Important Recruitment Metrics for 2021
Use this recruiting metrics cheat sheet to measure, monitor, report and evaluate your results in 2021:
- Time to fill: Cutting the time it takes to fill vacant positions helps keep the most talented applicants in the pipeline before they accept other work, and it cuts hiring costs with increased efficiency.
- Cost per hire: A key component of your budget planning, reducing the cost per hire shows the value of recruitment strategies and efforts. It’s a good way to show how your department is connecting to overall business goals.
- Quality of hire: Quality of hire measures the value that new employees provide based on productivity and other indicators such as performance appraisals, employee engagement, cultural fit and management satisfaction ratings.
- Attrition rate: High attrition rates reflect poorly on the recruiting process and can signal it’s time to try and attract a higher caliber candidate or candidates who better fit the position, experience level and/or culture.
- Candidate engagement: The overall effectiveness of your recruiting process begins and ends with the ability to attract and engage highly qualified, talented candidates.
- Candidate NPS: How likely is a candidate or employee to recommend to apply to work at your company? This can be used to track improvement over time, as well as benchmark against other companies.
- Candidate experience: Make the application process as simple and efficient as possible to attract top talent and find areas for improvement.
- Diversity metrics: Power your team with people from different and diverse backgrounds to enhance innovation.
10 Strategic Tips for Measuring Recruitment Effectiveness
Gathering and reporting recruitment metrics is just the beginning. You need a strategic approach to align results with business goals. Use these tips to gather recruitment effectiveness metrics and improve your recruiting efforts:
-
Assess Current Need
Look at current openings as well as areas with traditionally high turnover to assess current hiring needs. When considering your current needs and recruitment funnel, analyze how it stacks up to hiring trends. For example, Glassdoor reports 45% of job seekers use a mobile device to search for jobs at least once per day. Are your career website and online application processes optimized for mobile experience? Use these trends to your advantage and track the results with metrics like candidate experience and net promoter score. -
Forecast Future Need
Look ahead and anticipate possible hiring needs. For example, are new locations, product lines or projects being rolled out? Are some of the roles you might need to fill usually competitive? Or do you have historical data to show how long those roles might take to fill?And stay informed of hiring and labor market trends in your industry. Do your recruitment metrics indicate exposure to a limited supply of in-demand candidates? Do your turnover and engagement trends improve or decline during competitive job market cycles? Share demand forecasting with hiring managers to implement hiring strategies aligned with business objectives.
-
Take Current Talent Inventory
Keep a talent inventory and include a list of the in-demand candidates, talent gaps and specific skillsets management desires. Pay attention to the positions with the longest time-to-fill metrics. Track data on the job openings with the worst results in key recruitment metrics so you know where to make changes. Specifically, look at the interview-to-hire ratio, selection ratios and applicant-per-opening metrics. Share what you learn with hiring managers and recruiting teams. -
Determine Talent Mix Required to Fill Talent Gaps
Define the skills and experience that could fill talent gaps in your company. Actively source and engage candidates with those skills and experience to improve your overall talent mix. -
Define Pool of Internal Candidates
Understanding the strengths and weaknesses of your employees helps you identify gaps in your current mix of talent. It also helps with possible lateral moves to fill positions or promotions to help with employee engagement and retention. -
Assess the Availability of External Candidates
Recruiting candidates before they’re actively seeking employment is a proactive strategy that can pay long-term dividends. Engage with in-demand candidates ahead of an actual need for their skillset and continue to assess their availability with strategic touchpoints. -
Measure and Assess Promotion Rates
When a new position opens, how often are internal employees promoted? Career growth is a key measure for employee engagement and can often cut down on training and turnover costs. -
Measure and Analyze Turnover Rate
A high turnover rate raises your recruiting costs. Keeping turnover down with employee engagement and retention programs can reduce recruitment costs. Additionally, effective recruiting can affect turnover by finding the right candidate for the position. -
Focus on Increasing Candidate Engagement
Help excite applicants to work for you. Make it easy for them to engage with you by keeping communication clear and concise and sharing and sticking to a hiring timeline. Ask for feedback from candidates you hire and many you don’t. -
Continually Refine Sourcing Strategies and Tactics
Use channel source cost and recruitment effectiveness metrics to focus your efforts and spend your money more effectively. This recruitment data is a great tool to communicate your sourcing strategies with staffing agency partners.
Linking Recruitment Metrics to Business Objectives and Outcomes
What can you learn from recruitment metrics? They can help link your recruiting efforts to the success of your business.
Reduce Costs and Expenses
The most common business benefit is cost savings. You can demonstrate cost savings from your recruitment activities. For example, by improving your sourcing channel metrics, you can focus your ad and posting spend to be more effective and attract more and higher quality candidates. Or by automating the interview process, or refining the selection so there are fewer interviews, you save time for the hiring managers.
Increased Revenues
Recruitment can help improve company revenue by hiring qualified candidates who reach optimum productivity levels. Some of the factors recruitment teams can work on to attract high quality candidates include an efficient recruitment funnel, easy application process, and clear and concise communication throughout the hiring process.
Either through tightening up your recruitment funnel and improving efficiency, or by recruiting the caliber of candidate who contributes to the business, HR teams can have and demonstrate an impact on the bottom line.
How to Streamline Recruitment Metrics Reporting and Operations
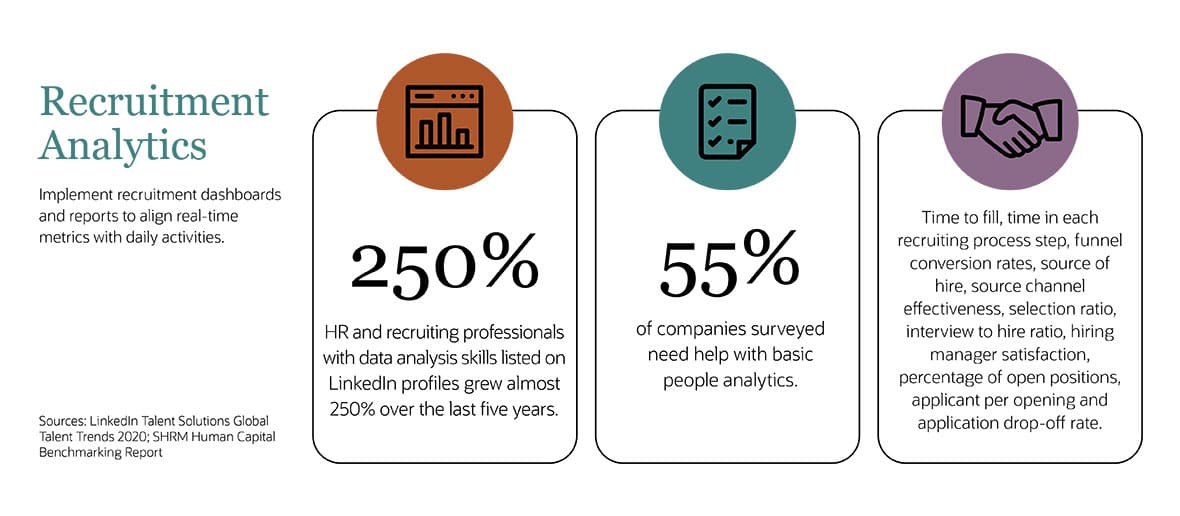
Recruitment metrics are the vital signs of your HCM strategy. So you may ask yourself, “How can I have better visibility into recruiting metrics?” Well, to maximize data-driven talent acquisition, minimize recruiting costs and enhance employee experience, you need access to accurate, real-time recruitment data, and using dashboards with your HRMS is one of the best ways to visualize and understand that data.
How do you measure recruitment effectiveness? Use a recruitment dashboard that provides an overview of key metrics and provides a way to visualize historical data across all recruiting functions. This data-driven decision-making tool can help you ask and answer questions about the cost-effectiveness and ROI of recruitment activities. HRMS platforms offer integrated cloud-based dashboard features that offer an easy way to share and optimize recruitment data.
Human resources management systems are integrated software platforms that go beyond ATS capabilities to empower data-driven talent acquisition with business-intelligence powered dashboards and reporting features. HRMS platforms aid recruiting by providing a single source of truth for metrics. Companies with an advanced HRMS can replace fragmented monthly metric reports with real-time, top-line revenue KPI dashboards and improve accountability.
Recruitment metrics managed with an HRMS platform arm HR and recruiting professionals with data-driven insights that provide a holistic view of how your recruiting process aligns with your business strategies.