
When done right, data analysis empowers companies to optimize operations and identify opportunities in deliberate and targeted ways. However, even veteran analysts can make mistakes, compromising the accuracy and usefulness of their findings. These errors often stem from undiscovered inefficiencies, including inconsistent processes, poor quality control, and disjointed or isolated datasets. But by understanding and avoiding these common pitfalls, businesses can better leverage their data to grow revenue and maintain their competitive advantage.
This article explores 11 common data analysis mistakes and provides practical strategies to overcome or prevent them. By developing a comprehensive framework, analysts can confidently maintain data quality and make sure their efforts deliver insights that directly support their business’s goals.
What Is Data Analysis?
Data analysis is the systematic process of examining, cleaning, transforming, and modeling data. Thorough analysis can uncover meaningful revelations about a company and its performance, which managers and leaders use to arrive at informed decisions. Then, analysts can use metrics and perform additional data analysis to monitor these decisions’ impact on the business and its financial health. By collecting and reviewing data from various sources, analysts can help leaders identify patterns, evaluate key performance indicators (KPIs), and make evidence-based predictions about future trends and outcomes.
The 4 Types of Data Analytics
By studying the different varieties of data analytics, business leaders can determine which approach or combination of methods best fits their specific needs and objectives. The following four types of analytics work together, creating a progression that begins with determining what happened and continues to predicting and influencing what should happen next.
- Descriptive analytics examines historical data to identify patterns and relationships. Analysts use descriptive analytics to answer the question “What happened?” using summaries of past performance demonstrated through KPIs, such as revenue growth, customer acquisition costs, and inventory turnover rates.
- Diagnostic analytics takes descriptive data and digs deeper to understand why specific outcomes occurred. This approach focuses on cause-and-effect relationships, analyzing multiple variables and their correlations to identify the root causes of both successes and failures.
- Predictive analytics uses statistical modeling, artificial intelligence (AI), and/or machine learning (ML) to forecast future outcomes based on historical data and expected shifts. Businesses can use these projections to anticipate changes in the market and in customer behavior, as well as identify potential risks before they materialize.
- Prescriptive analytics recommends specific actions based on a combination of predictive analysis, business rules and capabilities, and mathematics. This advanced form of scenario modeling empowers decision-makers to take the best course of action to meet or influence desired outcomes while considering potential constraints and trade-offs.
Key Takeaways
- Data analysis mistakes often stem from subpar quality control and inconsistent processes.
- Standardized data collection and validation protocols allow companies to maintain high analysis benchmarks.
- Effective analysis goes beyond collecting information to also involve relevant stakeholders who can contextualize data and choose appropriate metrics to align analyses with business objectives.
- Automation and analytical tools can help prevent common mistakes by standardizing data formats and identifying outliers, freeing analysts to focus on interpretation and strategy rather than cleanup and validation.
Data Analysis Mistakes Explained
When companies make mistakes during data analysis, it can limit their ability to transform raw information into actionable findings, which can hinder decision-making and hamper growth potential. Even when data analysis processes are in place, poor application can lead to confusion, slowdowns, and unnecessary costs. For example, misinterpreting customer purchase patterns might cause a factory manager to set suboptimal inventory levels, creating higher carrying costs and clutter. Or, overlooking key operational data could allow inefficiencies in production processes to persist, causing slowdowns.
The consequences of data analysis mistakes extend beyond immediate performance issues to strategic planning failures. Without proper analytics protocols, leaders may miss emerging market changes or important trends, or fail to identify risks before they show up on the bottom line. These oversights often arise when analysts work with inaccurate, incomplete, or outdated data, resulting in flawed conclusions and missed opportunities. But with comprehensive data quality controls and validation processes, business leaders can implement detailed strategies with confidence.
Why Is Data Analysis Important?
Companies rely on data analysis to create and maintain their competitive advantage through faster, more informed decision-making across departments. According to Intersystems’s 2022 Top Data and Technology Challenges in Financial Services survey, 86% of respondents “lack confidence in using their data to drive decision-making,” citing delays, lack of availability, and formatting problems as the top three issues. While many businesses collect vast amounts of data, those that can analyze it quickly and accurately gain unique perspectives into their customers, revenue sources, and internal processes that they might miss with only surface-level or inaccurate reporting. The benefits of strong data analysis reach critical areas, such as compliance, where systematic analysis can identify potential fraud and ensure that the company is following all relevant regulations. Furthermore, data analysis helps businesses validate their initiatives with evidence, rather than relying on intuition alone, which helps verify that future strategies and resource allocation align with actual needs and current market conditions.
11 Common Mistakes Data Analysts Make
When working with complex datasets, even the most experienced data analysts can fall into traps that compromise their findings’ accuracy and usefulness. By recognizing typical pitfalls, analysts can implement practices to avoid them and derive more value from their data. Let’s explore 11 common mistakes that can undermine data analysis efforts, along with strategies to avoid them.
1. Overfitting
Overfitting refers to models that match training data too precisely, including its random fluctuations and noise. Although these models might show excellent results with existing data, they often fail when describing new datasets because they’ve learned patterns based on outdated market trends, coincidences, or outliers and don’t actually represent current business conditions. To avoid overfitting, analysts should test their models regularly, using fresh data, to maintain a balance between model complexity and predictive accuracy.
2. Poor Data Visualization
Ineffective visualization can obscure important insights or mislead stakeholders with regard to the significance of the data at hand. Even if the data is sound, inappropriate chart types, too much information in a single visualization, or misleading scales and axes can produce poor communication, misdiagnosis of problems, and suboptimal strategy development. Analysts must carefully select visualization methods, such as data storytelling, that communicate their findings clearly, in a way that takes into account their audience’s familiarity with different chart types and technical concepts.
3. Biased Data Samples
Using biased or unrepresentative data samples can result in inaccurate conclusions that don’t reflect real conditions. Skewed data often occurs when analysts rely on convenient but limited datasets or fail to consider variations, such as seasonal shifts or changing market segments. In addition to financial inaccuracies, biased data can contribute to unintentional customer discrimination, potentially exposing the business to liability and reputational harm. To maintain objectivity and guarantee that customers are treated fairly, companies should review and update their sampling methods regularly and prioritize a wide data spread that captures information from all relevant time periods, customer segments, and operations.
4. Unclear Goals and Objectives
Starting data analysis without clearly defined objectives and scope often wastes resources and produces irrelevant outcomes. Analysts should fully understand what questions they need to answer and which metrics matter most, so they can minimize time spent on analyses that don’t address stakeholders’ needs. If the sales team needs a forecast for the upcoming quarter, for example, data analysis should focus on historical and seasonal sales data, expected demand, and industry trends. By first establishing specific, measurable goals, leaders can be confident that their analytical approach aligns with the business’s strategic priorities and delivers relevant and actionable recommendations.
5. Inconsistencies in the Data
Inconsistencies arise when data from different sources uses varying languages, formats, metrics, or measurement standards. For example, sales data might track revenue KPIs in a variety of currencies, potentially creating calculation errors and unreliable conclusions. Therefore, analysts must first convert this information to a standard format before it can be used effectively. To minimize—or, better yet, eliminate—this step, managers should implement strict data entry and governance policies with consistent formatting and measurement standards for all sources.
6. Redundant Data
Duplicate data can skew results, clutter databases, and waste storage resources, especially for companies with large and complex datasets. It can also overrepresent certain data points, creating bias in the analysis. Redundant data often occurs when data is collected from multiple sources without applying proper deduplication processes, or when historical data isn’t properly archived. For example, a customer making in-store and online purchases might be counted as several customers if their information is stored in separate databases, leading to duplicate payment records or incorrect customer counts and purchasing patterns. Regular data audits and automated deduplication processes, often aided by data validation tools, help businesses maintain clean datasets.
7. Incomplete Data
Working with incomplete datasets can result in untapped prospects and inaccurate findings. Missing data, partial records, or time gaps can create blind spots in analyses and generate incorrect assumptions about relationships between variables and performance metrics. Ongoing quality checks allow companies to identify gaps in their datasets and develop protocols for handling missing information, such as statistical methods for data imputation or clear documentation of limitations when presenting findings.
8. Dismissing Outliers
While businesses typically identify and remove one-off outliers to minimize their impact on data, completely dismissing outliers can cause analysts to miss important signals or emerging trends. Unusual data points can serve as harbingers of problems or new opportunities in the market. An unexpected spike in customer complaints from a specific region, for instance, could reveal a localized service issue, while unusual sales patterns might signal evolving customer preferences. Because many outliers require case-by-case analysis, companies should develop clear criteria for distinguishing between data errors and meaningful outliers that warrant attention.
9. Ignoring the Larger Context
To accurately assess performance, data teams must place all data in a broader business context, including historical data and market research. For instance, a decline in sales might appear alarming in isolation, but it could be no more than a seasonal drop that typically rebounds without intervention the following quarter. Similarly, an increase in website traffic might seem positive, but may not translate to any real increase in sales if it stemmed from a poorly targeted marketing campaign. Analysts should always consider a range of factors, such as industry trends, seasonal variations, and competitive dynamics, when determining which trends are worth pursuing with more detailed analysis.
10. Formatting Errors
Inconsistent data formatting across systems can create significant analysis problems and errors when merging or comparing datasets. Analysts should establish clear guidelines and implement automated validation checks for common formatting issues, such as different date or unit formats, and inconsistent naming conventions, such as listing customers’ first names first in one database and last names first in another. These seemingly minor inconsistencies can create a disjointed view of the business or trigger major slowdowns and resource strain during analyses. Even small mistakes can prove catastrophic, such as the 1998 Mars Climate Orbiter failure, where the spacecraft burned up in Mars’s atmosphere because units were improperly converted to metric. To streamline workflows in data-heavy departments, such as sales and accounting, many companies leverage digital tools and AI algorithms to replace manual processes and minimize errors.
11. Using the Wrong Metrics
Selecting inappropriate metrics can prompt businesses to prioritize the wrong outcomes and miss crucial perspectives. For example, if a retailer uses data that focuses solely on total revenue without considering margins, it might miss underlying profitability issues, such as rising material costs. Analysts should work closely with stakeholders and managers to identify which metrics best align with the business’s operations and goals. These chosen metrics should also be regularly revisited and adjusted as circumstances change to guarantee that analysts are monitoring the most relevant and impactful factors for their ongoing success.
Best Practices for Data Analysis
To minimize mistakes and maximize the value of their analyses, businesses should create consistent and standardized information processes companywide. The following best practices provide a road map for successful data analysis implementation.
- Clarify your goals before beginning analysis. This ensures that all efforts align with business priorities and are aimed at achieving useful and relevant goals.
- Standardize your data by establishing consistent formatting and measurement standards for all data sources—especially in financial and accounting data, where mistakes can significantly impact the business’s view of its financial health. Regular validation checks and automated data entry also help maintain data consistency, reduce cleanup time, and update standards as data practices and goals evolve.
- Center accuracy by implementing rigorous data validation processes and quality controls. Regular quality audits help identify and correct errors before they impact analysis, increasing overall quality standards in the future.
- Encourage stakeholder input early in the analysis process to affirm that their needs are understood and met. Collaborative expertise can enhance brainstorming to develop strategies, choose relevant metrics, and identify potential blind spots.
- Review data entry processes for errors and document clear procedures to clarify how employees and management should collect and enter data. Additionally, regularly train staff and implement automated validation tools as part of an ongoing strategy to improve accuracy and efficiency.
- Make sure formats are consistent by creating templates and guidelines for data formatting across all departments, retraining staff whenever these formats change. This allows apples-to-apples comparisons and reduces integration issues to speed up analyses.
- Test for bias by regularly examining data collection methods and samples for incomplete or skewed information sources. This confirms that conclusions reflect true conditions and that all customers and employees are represented fairly.
- Contextualize your findings by considering broader market conditions and business factors when interpreting results. Assessing both internal and industry trends prevents misattribution of causes and effects and helps leaders focus on appropriate root causes, rather than waste resources addressing symptoms of deeper issues.
- Leverage automation and AI tools for routine data cleaning and validation tasks. Automation reduces human errors and frees analysts to focus on higher-value activities, such as interpretation, communicating findings to stakeholders, and strategy development.
Leverage Analytics Software for Better Decision-Making
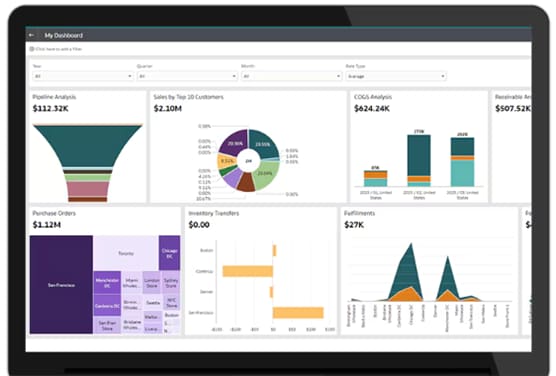
As businesses rely on growing and increasingly complex datasets, they need robust tools to conduct high-quality analyses. With NetSuite SuiteAnalytics, companies can avoid common data analysis mistakes through comprehensive reporting features, such as automated data validation and real-time visibility across all operations. NetSuite’s centralized platform eliminates inconsistent formatting and redundant information by automatically integrating data from multiple sources into standardized templates.
Once data is collected, AI-powered analytics can identify meaningful patterns and outliers that might otherwise be missed. And when it’s time to present their findings, analysts can leverage NetSuite’s customizable dashboards and visualization tools to communicate clearly and effectively to all stakeholders, regardless of their technical expertise. By automating routine tasks and expanding analytical capabilities, NetSuite SuiteAnalytics gives teams more time to focus on strategic decision-making and business growth initiatives, rather than data collection and cleanup.
Data analysis errors can significantly impair a company’s ability to make informed decisions and maintain a competitive advantage in today’s data-driven marketplace. By understanding common pitfalls and implementing strong analytical practices, businesses can reliably leverage their raw data to drive growth and innovation. But success requires more than collecting information; it demands careful attention to quality, consistency, and context. When businesses combine these fundamentals with modern digital tools, they can confidently identify opportunities, improve operations, and make well-informed decisions that enhance financial performance.
Data Analysis Mistakes FAQs
What makes data analysis difficult?
When analyzing data, businesses often struggle with the volume of data required, especially when it comes from multiple sources with different formats and quality standards. This inconsistency forces analysts to clean and standardize this data to ensure its accuracy and relevance to the specific questions at hand.
What are a few major hurdles faced by data analysts?
Many data analysts must tackle incomplete or inconsistent datasets that require extensive cleaning before they can begin to derive any meaningful insights. They must also balance competing priorities and timelines from stakeholders, as well as meet various compliance requirements and security standards. Furthermore, after data analysts complete their work, they must communicate complex findings to nontechnical stakeholders in a way that minimizes misunderstandings.
Why and how does data analytics fail?
Data analytics initiatives typically fail when companies lack clear objectives or attempt analysis without quality controls and validation processes, which can lead to irrelevant or misinformed outcomes. Failure can also occur when analysts choose inappropriate analytical methods for their questions or draw conclusions without incorporating important context. Without proper data governance and frameworks in place, even sophisticated analyses can produce inaccuracies and result in poor business decisions.