
Dentists go to school to practice dentistry, not to run a business. But running a dental practice is a business, and the math has gotten harder. Expenses per dentist have risen 3% over the past five-year period as compared to the prior period, while revenue per dentist has declined 1.2%. Case in point: In some markets, insurance reimbursement for a cleaning no longer covers the hygienist’s hourly rate. The result: Profit margins are evaporating even at practices that stay busy. This article examines what spurs dental practice profitability and where the biggest opportunities for improvement lie.
What Is Dental Practice Profit?
Dental practice profit is the money left after the bills are paid—essentially, what ends up in the business owner’s pocket after covering staff wages, rent, supplies, lab fees, and everything else it takes to keep the practice running. Profit is expressed as a profit margin, or the percentage of total collections that remains as profit. With costs generally consuming 58% to 68% of collections, the remaining 35% to 42% represents profit margin for well-managed practices.
Key Takeaways
- Dental practice profit is what remains after subtracting all operating expenses from total collections.
- General practices typically target profit margins of between 30% and 40%.
- Factors that are compressing margins for some practices include insurance reimbursements that trail inflation, staffing challenges, and rising supply costs.
- Tracking financial benchmarks, such as overhead rate and chair utilization, helps practice owners understand where profitability is compromised.
- Reducing insurance dependence through membership plans and diversifying into higher-margin services are among the profit strategies gaining momentum.
Dental Practice Profit Explained
Most small businesses sell products or bill for time. Dental practices operate differently: They sell clinical expertise, delivered in a chair, one patient at a time. Revenue comes from production, including cleanings, exams, crowns, fillings, extractions, and specialty procedures. From that revenue, the practice has to subtract overhead—staff wages, rent, supplies, lab fees, equipment, malpractice insurance, and the administrative drain of billing and collections.
What’s left is profit. The percentage of that profit, as represented against total collections, is the margin. For example, a practice billing $900,000 a year with $540,000 in expenses keeps $360,000, yielding a 40% profit margin. Every dollar saved on overhead flows straight to the bottom line. But margins don’t depend only on expenses. They also hinge on who’s paying for services and how much of the bill gets collected. Many dental practices participate in preferred provider organization (PPO) insurance networks. As part of the arrangement, they accept discounted fees in exchange for patient referrals. Those discounts add up. A practice that relies heavily on PPO insurance usually collects significantly less per procedure than one billing at full fees. The clinical work is the same, but the revenue isn’t. A packed schedule doesn’t guarantee healthy profits if a large chunk of every bill gets written off to meet insurance contracts.
Drivers of Dental Practice Profitability
Profitability in a dental practice is shaped by multiple factors working in concert—some within the owner’s direct control, such as overhead and fee setting, and others that require workarounds, such as insurance reimbursement rates and local market dynamics. Here are the key levers that determine whether a busy practice is also a profitable one:
- Patient visits: Production starts with patients in chairs. A steady flow of new patients, combined with strong retention of existing ones, keeps revenue healthy. But filling chairs also requires staff to treat those patients. Labor shortages have forced many dental practices to turn away appointments they might otherwise have booked. The American Dental Association estimates that labor shortages have caused an 11% reduction in dental practice capacity nationwide.
- Geographic location: The success of a dental practice is influenced by its location, in ways that include local income levels, what competitors charge, insurance reimbursement rates, and how hard it is to recruit staff. Urban practices, for example, tend to deal with higher overhead but draw from deeper patient pools. Rural areas, on the other hand, may struggle with both patient volume and staffing.
- Technology adoption: Several types of technology can help practices build more fluid workflows that free up staff time. These include practice management systems, digital radiography, automated appointment reminders, intraoral scanners, and AI-assisted diagnostic tools. But the practices that see the most benefit tie technology to specific outcomes, such as faster billing cycles or more accurate diagnoses. Chasing features without having a clear purpose for choosing them rarely pays off.
- Fee setting and insurance management: Heavy dependence on PPO insurance can lead to the acceptance of fee schedules that haven’t kept pace with costs. Moreover, network consolidation has made renegotiating those rates more difficult, especially for solo and small-group practices that lack leverage. Shifting to fee-for-service patients or to in-house membership plans—where patients typically pay $300 to $500 a year directly to the practice for preventive care and treatment discounts—can ease some of that pressure.
- Expenses and overhead: Staff wages, supplies, lab fees, and rent make up the bulk of what a practice spends. Labor costs, in particular, have been climbing faster than other categories as competition for hygienists and assistants has intensified. How tightly a practice manages these expenses often determines whether it runs profitably or just breaks even.
- Collections: What a practice bills and what it actually collects are two different numbers. Collections—the cash received after insurance adjustments and write-offs—is what overhead and margins are calculated against. Claim denials slow things down, as do aging receivables and patients who don’t pay their portion of the bill. Organized billing activities and ongoing follow-up matter as much as strong production.
- Growth: Adding providers and services or opening a second location can drive revenue growth. But these steps also bring new overhead: additional staff, higher rents and insurance premiums, and greater management complexity. Practices that scale profitably plan for those costs up front.
Profitability in Specialty Practices vs. General Practices
General and specialty dental practices operate under different economics, and their profit profiles reflect that. General practitioners see a broad mix of patients for cleanings, fillings, crowns, extractions, and routine care. Volume tends to be higher, but collections per visit are lower. Specialists work differently. For example, an oral surgeon placing implants or an orthodontist fitting aligners performs fewer procedures but charges more for each one. Marketing costs tend to shift, too. Specialists usually receive referrals, rather than having to acquire patients directly, as most general practices do.
Some general practices are increasing profitability by bringing higher-margin services in-house. For example, implant placement, clear aligners, cosmetic work, and sleep apnea appliances fetch premium fees and usually aren’t covered by insurance. A general practice willing to invest in additional training and equipment can push production per patient closer to specialty-level numbers without relying on referrals. The trade-off is complexity. General practices enjoy the steady, predictable flow of hygiene visits and routine care. Specialty procedures bring higher per-case revenue but can be more dependent on case acceptance rates—that is, how often patients say yes to recommended treatment.
Financial Margins and Benchmarks for Dental Practices
Numbers tell the story. Tracking the right metrics helps practice owners see where profitability is holding and where it’s slipping. The benchmarks outlined below offer a framework for gauging financial stability.
Overhead Rate
Overhead rate measures what the practice spends to generate its revenue—or total operating expenses as a percentage of collections. Overhead rate is calculated using this formula:
Overhead rate = (Total operating expenses ÷ Total collections) x 100
As mentioned earlier, most general practices target an overhead of 58% to 65%. Top performers get below 60% by keeping a strong grip on staffing, supplies, and fixed costs. When overhead climbs above 65%, profits get squeezed fast, even if production looks solid.
Profit Margins
Profit margin is simply what’s left after deducting overhead; if a practice runs at 60% overhead, for example, its profit margin will be 40% (assuming the owner’s compensation is already included in expenses). This is technically closer to operating margin, which accounts for all operating costs. Gross margin, by contrast, subtracts only direct costs, such as supplies and lab fees, so it’s always higher. Profit margin is determined like so:
Profit margin = 100% − Overhead rate
As mentioned earlier, general practices typically aim for 30% to 40% margins. Specialists frequently land between 35% and 45%. Any margin below 25% is generally considered a warning sign that some area needs immediate attention; more often than not, something will prove to be amiss with overhead, collections, or payer mix.
Chair Utilization Rate
Chair utilization rate monitors how well a practice fills its available appointment slots. It’s calculated thusly:
Chair utilization rate = (Scheduled chair hours ÷ Available chair hours) x 100
An empty chair is lost production that can’t be recovered. Most practices try to keep chair utilization rate between 75% and 85%. Lower numbers may reflect no-shows, last-minute cancellations, scheduling problems, or a lack of patient demand.
Production per Hour
Production per hour measures how much revenue each hour of clinical time generates. It’s determined using this formula:
Production per hour = Total production ÷ Total clinical hours
Production per hour shows whether chair time is converting into revenue efficiently. Practices with a heavier mix of implants, aligners, cosmetic procedures, and other higher-margin services tend to see stronger numbers than those focused on hygiene and basic restorative work. Weak production per hour may signal a procedure mix problem, inefficient scheduling, or low scheduled fees.
Case Acceptance Rate
Higher case acceptance rates increase production without the need to find new patients. Average dental practices see acceptance rates in the 40% to 50% range for existing patients, while strong practices reach 70% or higher. Low case acceptance rates often reflect a breakdown somewhere along the way; perhaps treatment isn’t being explained clearly, the cost conversation is awkward, or patients don’t feel the urgency to move ahead with a particular procedure. Here’s the formula for case acceptance rate:
Case acceptance rate = (Accepted treatment value ÷ Presented treatment value) x 100
Patient Retention Rate
Patient retention rate tracks how many patients return for ongoing care and is calculated like so:
Patient retention rate = (Patients returning within 18 months ÷ Total active patients) x 100
As the familiar saying goes, keeping a customer costs far less than finding a new one. Retention above 80% usually leads to stable, recurring revenue. Falling retention usually points to customer experience issues, such as long wait times, scheduling problems, poor communication, or competitors making inroads.
Patient Acquisition
Patient acquisition simply tracks how many new patients the practice brings in over a given period, typically expressed as new patients per month. A healthy general practice usually needs 24 to 50 new patients per month, depending on its size and growth goals. That flow offsets natural attrition from patients who move, switch insurance, or otherwise drift away. Practices falling short of that range may struggle to sustain revenue over time.
7 Tips for Improving Dental Practice Profitability
There’s no single fix for achieving dental practice profitability, but there are patterns. Practices with consistently healthy margins tend to execute the following strategies particularly well:
- Lower overhead costs: Overhead has a way of adding up. Staff wages are almost always the biggest line item, followed by supplies, lab fees, and rent. Dealing with these expenses requires careful attention. Consider renegotiating vendor contracts or joining a buying group of independent practices that pool their purchasing power to negotiate volume discounts from suppliers. Reviewing staffing levels against actual production requirements can also reveal opportunities that aren’t immediately obvious. Small improvements in multiple areas compound faster than most owners expect.
- Focus on increasing new bookings: Empty chairs drag down profitability; filling them takes steady effort. Referral relationships are important, as are online presence and customer experience. Automatic reminders and confirmation requests can help identify cancellations early. That said, patient demand isn’t always the problem. If practices can’t hire enough hygienists or assistants to see more patients, marketing won’t solve the issue. Capacity and demand have to grow together.
- Adjust fee schedules: Many practices haven’t raised fees in years, even as costs have climbed. Reviewing fee schedules annually—and actually adjusting them—helps prevent slow margin erosion. For practices locked into PPO contracts, renegotiating rates or dropping the lowest-paying networks may be necessary. In-house membership plans are also gaining ground because they bypass insurance companies entirely. Membership patients tend to accept more treatment and build stronger per-patient production than those using insurance.
- Maximize production per visit: Getting more value from each appointment, without overtreating, lifts revenue. That might mean same-day treatment when clinically appropriate or improving case acceptance with clearer explanations and visual aids. It could also mean expanding the practice’s service mix. Implants, aligners, cosmetic procedures, and sleep apnea treatment all fetch higher fees than restorative work. Practices willing to invest in training and equipment can shift their production profile meaningfully.
- Optimize provider schedules: Aligning dentists’ hours with patient demand sounds elementary, but many practices leave money on the table. Examples include long intervals between appointments or hours that don’t match when patients actually want to come in. Reviewing appointment data often reveals opportunities—for example, shifting a provider to different days or cutting back hours that consistently run empty. Practices struggling to hire may need to think even harder about where to focus limited staff time.
- Invest in staff education: A skilled team improves profitability in ways that go beyond clinical care. Front desk staff who verify insurance accurately reduce claim denials. Treatment coordinators who can clearly explain procedures and costs boost case acceptance. And staff who understand how their daily work affects the practice’s bottom line—whether that’s preventing no-shows, minimizing supply waste, or improving collections—tend to make smarter decisions without being micromanaged.
- Use software: Practice management systems and financial tools give owners the power to see what’s actually happening. Production, collections, overhead, patient flow—all of it can be tracked in real time instead of reconstructed at month’s end. For example, automated billing cuts down on administrative hours, and scheduling tools fill production gaps and curtail no-shows. Business intelligence tools help identify negative trends before they become problems. And cloud-based platforms make all this accessible from anywhere and able to scale as the practice grows.
Drive More Revenue to Your Practice With NetSuite
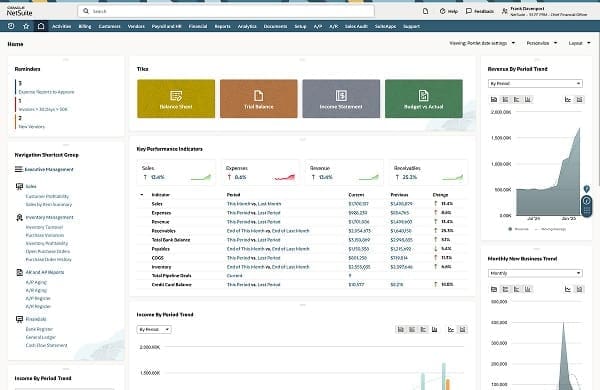
When financial data lives in spreadsheets and billing runs through one system while scheduling goes through another, it’s hard for a dental practice to see the full picture, much less act on it. NetSuite Dental ERP brings financial management, reporting, and operations onto a single cloud platform. Practice owners get real-time visibility into revenue, expenses, and cash flow without waiting for month-end reconciliations. Automated billing and collections-tracking lessen the administrative load. Built-in analytics reveals warning signs early, such as rising overhead, slowing collections, or declining retention. For practices planning to add providers, locations, or services, NetSuite scales without incurring a system redesign.
Financial Management Made Easy With NetSuite ERP
Dental practice profitability comes down to managing the business with the same attention to detail applied to patient care. That means tracking the right numbers, controlling costs, paying attention to payer mix, and making decisions based on real data. Practices with consistent, healthy margins treat profitability as a discipline, not something that happens on its own.
Dental Practice Profitability FAQs
What is a good profit margin for a dental practice?
For a general dental practice, a healthy profit margin typically falls between 30% and 40%. Top performers push above 40%. Specialists often land between 35% and 45%. Margins below 25% usually point to structural problems, such as high overhead, low collections, or a payer mix that doesn’t work.
Is owning a dental practice profitable?
It can be, but outcomes vary widely. Location, payer mix, overhead management, and patient volume all play a role. Practices that actively manage their finances tend to outperform those that focus only on clinical work and hope the numbers take care of themselves.
How can I tell if my practice is financially underperforming?
Warning signs include overhead above 65%, shrinking profit margins, accounts receivable that keep aging, case acceptance rates below 50%, and patient retention that’s trending downward. Comparing your numbers against industry benchmarks and watching how they change over time can help pinpoint where the problems lie.