
Sales teams have used metrics to track progress and success for decades. But the reports of yesterday were static, overwhelmingly detailed, and incompatible with how the human brain converts information into insight. Today, data-oriented decision-making has expanded to embrace marketing and customer service teams, too. When those teams use customer relationship management (CRM) dashboards, they gain advantages in speed, precision, and focus by absorbing their most important KPIs and metrics from graphically sharp and clean visual displays.
Here’s how CRM dashboards can help a business’s sales, marketing, and customer service departments contribute to bottom-line business growth.
What Is a CRM Dashboard?
A CRM dashboard is a visual, customizable user interface for CRM software. It is used to monitor, measure, and analyze business and sales processes, team performance, and future opportunities in real-time for the purposes of making well-informed marketing decisions, providing superior customer care, and enhancing employee performance.
CRM dashboards are interactive, giving each team member access to the company’s most valuable tracking data on a single, shared platform. A well-designed CRM dashboard provides a snapshot of the most pertinent data points related to the team’s mission-critical goals and key performance metrics (KPIs). The data is aggregated from multiple sources across the organization, usually a combination of sales, marketing, and customer service activity, and expressed in graphs and charts.
By including only the most meaningful data in the dashboard, the company’s sales, marketing, and customer care professionals and their managers can mentally digest and immediately process the current state of their business. The more data on display and the more complicated the visual expression of the data, the less likely it will be adopted and used by all team members; selectivity of data and clear data visualization are key features of a successful CRM dashboard.
At their best, CRM dashboards help teams learn more about their clientele so they can offer a more personal touch, track team performance metrics to help managers motivate and reward employees, and help manage the processes and stages of the sales cycle, providing views of the big picture and access to the minutiae, as needed.
Key Takeaways
- CRM dashboards provide users with real-time visualization of sales, marketing, and customer service data.
- Businesses customize dashboards to display targeted KPIs and analyses that focus on relevant business priorities for different roles.
- Automated reporting and advanced analytics tools help teams track performance, spot trends, and improve customer satisfaction across the customer lifecycle.
How CRM Dashboards Work
CRM dashboards pull real-time data from devices and applications like Google Calendars and Tasks, human resources (HR) software, ecommerce platforms, the business’s own website and social media, sales tracking software, email marketing software, and accounting software. Dashboards present that information via graphs and charts displayed on a single screen, providing a close look at data within a particular time frame. As the data inputs change, so do the graphic reports, giving managers and staff up-to-the-minute insights into business developments. Importantly, CRM dashboards are flexible; key metrics can be swapped out and updated to reflect changing priorities in the business.
A CRM dashboard best practice is to have five to seven reports visible, given the limits of the human mind to make sense of more than seven ideas at once. These should relate to the business’s most important goals and the KPIs used to measure them. The most useful CRM dashboards display information related to major business objectives, enabling the sales and marketing team to track the elements of their workflow that contribute to the organization’s success. It’s important to include a mix of backward-looking, future-focused, and in-the-moment insights among the top reports to gain a macro view of business progress.
Monitoring progress on KPIs over time gives companies the intelligence to make better, data-informed decisions in the moment and in the long term.
Video: NetSuite SuiteSuccess for Services: CRM
Who Uses CRM Dashboards?
A good, goal-focused, user-friendly CRM dashboard adds fuel to the productivity and performance of sales, marketing, and customer service teams, and supports the planning and decision-making of the leaders who manage them.
Team members who use CRM dashboards can individually track their sales numbers, goals, meetings, hours, and tasks, helping them to prioritize the right efforts toward the deals that help them meet their quotas. Email and calendar management features keep them organized and synced. Sales forecasting gives them a glimpse into their future sales, based on data from the current pipeline; visibility into their peers’ numbers stokes healthy competition.
For managers, CRM dashboards track the team’s activity and performance, which lets them give feedback and make changes based on real-time input. They can view completed tasks and individual goals, which comes in handy during performance reviews.
Marketing teams can set up CRM dashboards to show how well their campaigns are performing against their targets. Customer care teams can view detailed customer dossiers that enable them to tailor their support, and access details about previous conversations and purchases on the spot. C-suite leaders rely on CRM dashboards to get a quick summary of key business results.
When everyone on a team is looking at the same data, they communicate better, move faster, resonate with the team’s mission more tangibly, and feel a daily connection with future goals and projections.
Analysts estimated the value of the global market in 2024 at roughly $73.4 billion, with an anticipated annual percentage growth of 14.6% through 2030, according to Grandview Research.
CRM Dashboard Features
The most effective way to keep sales and marketing activities streamlined and efficient is to select dashboard features that tell a meaningful story about the business’s progress toward its goals. Part of that challenge is displaying the features in an organized, prioritized manner so that the dashboard is accessible and clear. Another part is deciding which features to include in each individual team member’s dashboard. However, regardless of the individual user, there are a few categories of features that every good CRM dashboard includes.
- Goals: This feature displays an overview of goals in progress, upcoming actions to complete, and time elapsed on your top goals. Supervisors can view goal information for their direct reports and determine whether those goals require their approval or reflection.
- KPIs: Carefully chosen KPIs communicate current progress relative to business goals, using designated metrics for success. Access to this quantified information helps team members prioritize daily activity in favor of tasks that move the needle forward on key metrics.
- Recent reports and report snapshots: Reporting is the feature that brings sales and marketing efforts together in one place. Recent reports list those that have been recently created, modified, or viewed. Report snapshots provide a graphical or list-type summary of data, with links to the full, underlying reports.
- Tasks and appointments: Manual tasks and automatically updated tasks are reflected in this feature, as a checkpoint for to-do items and their impending deadlines. Automated tasks, like the instant sending of a confirmation email to let a customer know their message has been received, make it easier for brands to behave attentively toward customers.
- Calendars, alerts, and reminders: A CRM dashboard functions as a clearinghouse for a team member’s most important business information, serving as a daily source of information and updates. It is useful to include other tools that help them do their jobs. Calendars, alerts and reminders are features that can help people monitor tasks and stay on track.
CRM KPIs and Metrics
CRM systems help keep track of all customer touchpoints. The most crucial performance indicators serve as measurement benchmarks for managing sales and marketing more effectively, assuring customer service is top-notch and optimizing all aspects of work processes. Any given CRM dashboard will be customized to suit its users’ goals and team style, but here are some important KPIs to consider.
Sales:
- Sales target: Are sales on track to reach top goals? This metric lets salespeople know where they stand versus their goals and lets sales managers know if their team is performing as it should. In comparing actual revenue against forecasted revenue, the objective should always be to exceed the forecast.
- Lead conversion ratio: This number is one of the most important sales metrics because it tells you how many interested leads become customers. Once a baseline ratio is established, the business can mathematically define how many leads to have in the pipeline—and how many reps to have on hand—to achieve a specific revenue goal.
- Revenue per sales rep: This KPI tells business managers how well the sales team is performing against an established baseline—usually either their budgeted revenue goal or their results from a previous period. It shows who the top performers are, how long each stage of the sales process takes each rep, and at which stage of the sales process reps tend to stall or lose the sale. These indicators inform managers about where their reps may need additional training or support to help them close more deals in less time.
Marketing:
- Cost per acquisition (CPA): This is a pricing model where advertisers pay a stated price per new customer. It is calculated by dividing the total costs of all acquisitions by the number of new customers in each period. It is used to detect how viable each channel is for acquiring new customers.
- Return on Investment (ROI): ROI is used to examine the efficiency of an investment or compare many investments. ROI is calculated by dividing the benefits of the investment by the costs of the investment; it is expressed as a percentage, the higher the better. It is useful in determining which channels and/or campaigns to invest your marketing budget in.
- Customer lifetime value (CLTV): One of the most important marketing KPIs, CLTV helps define how much money to spend for a new customer. It is calculated by the average order total multiplied by the average number of purchases in a year, multiplied by the average retention time in years. This provides the average lifetime value of a customer based on existing data. Higher CLTVs indicate that you are spending the right amount of money on customers, relative to their worth.
Customer Service:
- Customer satisfaction: The granddaddy of all customer service KPIs, customer satisfaction illuminates the issues your customers may be having that are lowering their overall impression of your brand. This question can be asked in many ways, but it almost always entails a rating of each customer’s experience with your brand, which is expressed as a percentage that typically notes satisfaction or dissatisfaction.
- Net promoter score (NPS): The best-known customer satisfaction metric, NPS measures the likelihood among customers to recommend the business to a friend, colleague, or family member. It is a predictor of loyalty and business growth and allows you to benchmark your business against competitors.
- Customer retention: In customer retention, loyalty is quantified as the number of repeat customers divided by the total number of customers. Every company should aim for a growing retention rate, as new customers are more expensive to cultivate than keeping existing ones.
How to Design an Effective CRM Dashboard
Designing useful CRM dashboards requires thoughtful planning and ongoing refinement to align layouts and features with specific business objectives. Follow the key steps below to create a dashboard that delivers value to all users, from analysts focused on a handful of performance metrics to leaders seeking a holistic view of their organizations.
- Identify the dashboard’s end users: Consider who will access the dashboard and customize layouts, metrics, and visualizations to reflect diverse needs. For example, sales teams will be interested in pipeline and conversion data, while customer service managers will want to focus on response times and satisfaction scores.
- Collaborate on which KPIs to include: Work with stakeholders to select metrics that best align with the business’s objectives, such as revenue goals or customer retention.
- Customize the dashboard: Arrange the dashboard’s visual elements to prominently spotlight the most critical and frequently accessed data. Think through how users will interact with each part of the interface.
- Configure data visualizations: Choose charts, graphs, and display formats that make complex data easily digestible. Consistent colors and layouts will enhance comprehension, such as presenting revenue as a line graph to convey performance trends over time.
- Set user permissions: Grant appropriate access levels to different team members to secure sensitive data without sacrificing needed transparency and accessibility.
- Monitor and iterate: Regularly review dashboard use and collect feedback from team members, especially power users who understand the ins and outs of the system. Adjust accordingly to maximize the CRM’s long-term benefits.
Inclusion of the following types of information helps paint an informative, targeted picture of the health of the business’s sales, marketing, and customer care to specific user roles.
- New leads and deals: These figures can be represented as a list of opportunities or a percentage of sales value across all possible opportunities.
- Forecasted sales: This information is usually presented in a bar chart showing how much revenue the business (or a product line, region, or individual salesperson) expects to close in a current or future period. A best practice is to present multiple deal stages and the anticipated probability of winning deals at each stage.
- Recent and upcoming activities: This feature logs all sales rep activity, giving managers an overview of how their team is spending its time. Data collected in this feature includes emails, calls, messages, stage changes, completed tasks, appointments, visits, and collaborations.
- Sales revenue goals: This feature tracks actual revenue against goals. Salespeople and their managers can also view revenue relative to the prior year, between competing regions and between sales reps or teams, giving an absolute and relative understanding of incoming monies.
- Sales rep performance: As employees complete tasks, this feature automatically adds the performance statistics to a report that is provided to leadership as a tool to manage, motivate, and inspire superior performance.
- Social media monitoring: A CRM dashboard that oversees social media activity will save time by aggregating all the monitoring tools in one location. Use this feature to perform social listening; keep tabs on comments, shares, and mentions; manage the daily tasks of posting to social media accounts; and glean insights into customer preferences and sentiment.
- Case management: A case management feature helps handle inbound cases that customers file in response to a problem or complaint. This feature sends automated email responses; routes cases to customer care reps, matching the complexity of the case with the skill level of the rep; and turns case communications into articles in a knowledge library for future reference.
CRM Dashboard Examples
Sometimes, the best way to bring abstract or complex concepts to life is with concrete examples. The following three images do exactly that for three different possible business personas in sales, marketing, and customer service. But remember: Dashboards are highly configurable, so any of the modules in any of these examples could be moved around within the dashboard or be replaced by the specific metrics most important to your business.
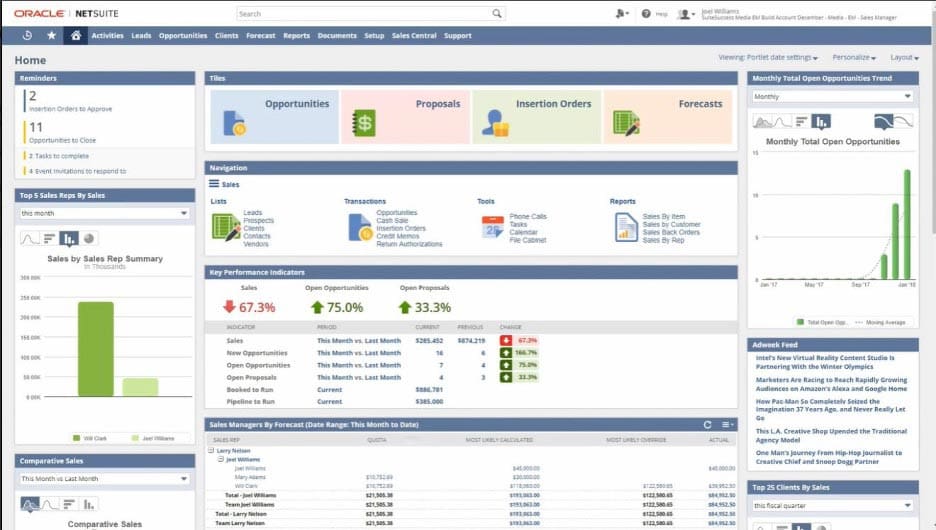
Sales Dashboard
The first example, below, is a CRM dashboard for a sales manager at a hypothetical NetSuite customer. The KPIs displayed in the center of the screen reflect this company’s priorities: sales, open opportunities, and open proposals. To the left is a tracker of sales by sales rep, designed to accurately measure the revenue contribution of each team member.
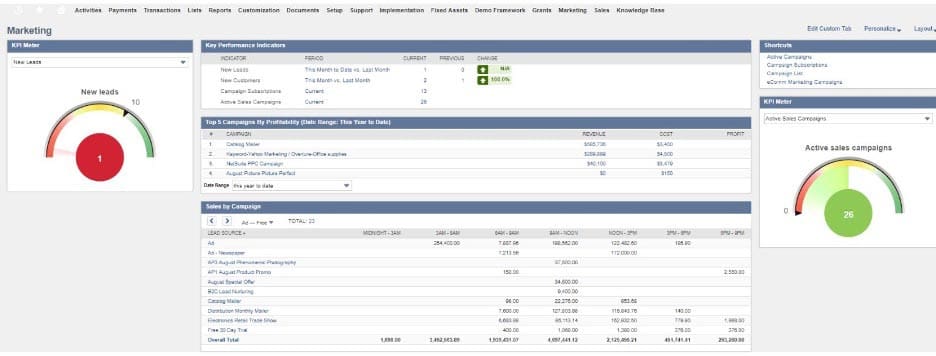
Marketing Dashboard
The second CRM dashboard example is for a marketer. Attention is drawn to sales by campaign and the top five campaigns by profitability, which are useful tools to help the marketing team quantitatively evaluate the effectiveness of their advertising campaigns.
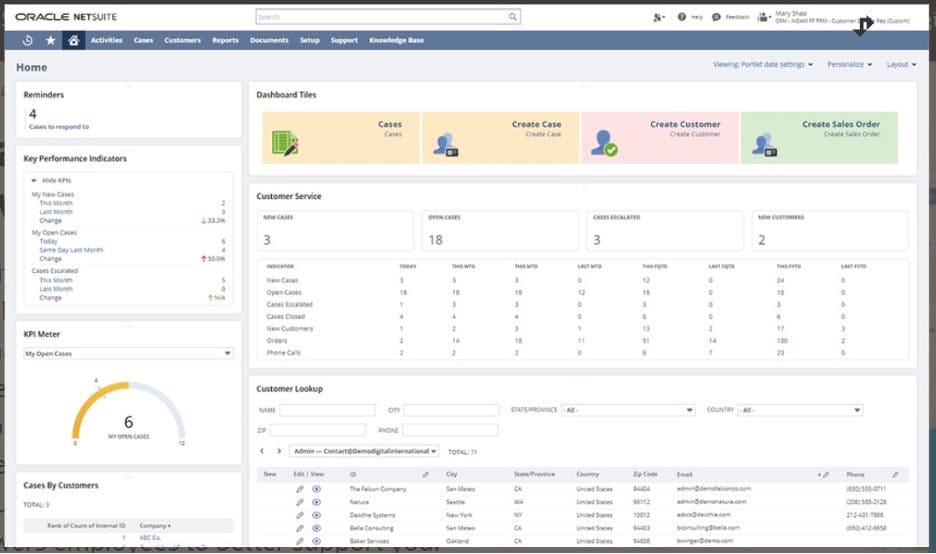
Customer Service Dashboard
The third example is a customer service dashboard. The emphasis is on instances of customer complaints (“cases”), how many cases are still open, and how many have been resolved. The user can view detailed data on each customer, including the number of cases per customer and the number of cases escalated. Each of those metrics helps customer care reps track their work and prioritize cases from more important and/or dissatisfied customers, helping them work smarter and harder.
What Makes an Effective CRM Dashboard?
Not all CRM dashboards are created equal. In fact, a poorly designed CRM dashboard will sow confusion, waste time, and probably be ignored by the people it is meant to support. To make sure your CRM dashboard is adopted by the team and used to improve the flow of work and the caliber of sales results, consider the following attributes:
- Intuitive design: Time is money for busy sales reps, so look for a dashboard that is quick to set up, simple to operate, and can be taught to the team in an hour or two. Training should be personalized, ongoing, and give team members hands-on experience with the dashboard. Request a demo of the features and functionalities to get a feel for its utility. Intuitive usability can be the defining line between software that optimizes the business’s sales process or metaphorically collects dust on a shelf.
- Adaptable and appropriate features: Choose a CRM dashboard that is highly adaptable and customizable to fit the needs of your team, rather than a one-size-fits-all model. It should complement your business and have tools and reports options that map to your sales process, your marketing strategy, and your customer service activities. Different staffers will need different features; sales reps will want advanced sales toolkits and to use them on their cell phones, whereas communications team members may only need marketing-related tools.
- Integration with other applications: CRM software should seamlessly integrate with the sources of data it will need to present a snapshot of the business’s goals and metrics. For most teams, this will include accounting software or an enterprise resource planning (ERP) system, the website, lead-generation tools, billing platforms, marketing solutions, and HR software. If the sales force is one composed of road warriors, make sure the software has mobile capability. And to help daily repetitive tasks feel easy and cohesive, the CRM dashboard should be able to sync with email accounts, calendars, and smartphones, giving team members one access point for all account-related information.
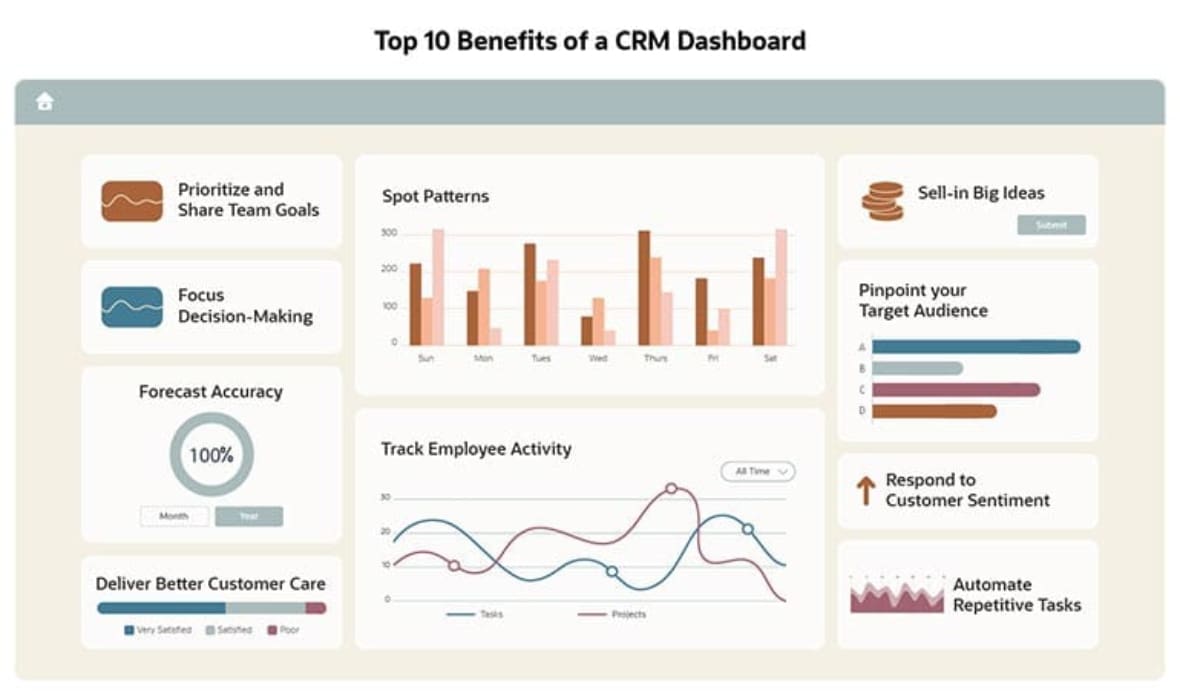
Benefits of a CRM Dashboard
Investing in a CRM dashboard yields a bounty of improvements to a business’s sales, marketing, and customer care functionality and performance. CRM dashboards should inevitably yield more efficiency in business processes, both high-touch and automated ones. Detailed insights, grounded in data, will refine your business decision-making. And the connectivity and automatic delivery of key information at the right time and place will help team members do their jobs better and with more ease. Here are the top 10 benefits of a CRM dashboard.
- Prioritize and share team goals: With a CRM dashboard, teams always know which goals are most closely linked to team success. It helps the business track progress, so you always know how close you are to achieving your objectives. And it informs team members of the tasks, projects, and prospects to prioritize so they proceed along the quickest path to achievement.
- Forecast accuracy: A CRM dashboard enables you to anticipate market changes so the business can take advantage of opportunities and mitigate risks. Predict the direction the business is going based on current trends, metrics, and insights to make real-time adjustments and improvements. Understand which marketing efforts are most effective so you can calibrate and optimize campaigns.
- Spot patterns: The clean visualization of data in a CRM dashboard helps people spot business trends quickly. It is far easier to tease out patterns from an easy-to-digest graph than from numerical spreadsheets, unstructured data, or long reports of the past. Get a better sense of how well marketing campaigns and sales strategies are working for your brand.
- Focus decision-making: CRM dashboards enable astute decision-making and focused action by answering key questions about sales, highlighting where and how to provide value and informing you of what is working well and what isn’t to support precise, data-informed decisions.
- Sell-in big ideas: The seamless data visualization in a CRM dashboard helps create a compelling and clear narrative to persuade colleagues and clients to adopt your strategies and business ideas.
- Pinpoint your target audience: CRM dashboards show exactly where audience members are being influenced—and which engagements are contributing more to the buying journey—so you can place marketing bets with greater accuracy and success.
- Deliver better customer care: The customer information that a CRM dashboard gathers and organizes helps reps deliver faster, more personalized customer support, leading to higher customer satisfaction. Streamlined processes reduce project turnaround times, which speeds up the sales journey and makes customers feel attended to and cared for.
- Respond to customer sentiment: The social media features of a CRM dashboard can be configured to perform social listening; monitor social actions like shares, mentions, and likes; and then recalibrate social media tactics automatically, based on preset campaign criteria.
- Track employee activity: With a CRM dashboard, business leaders can always know exactly how each team member is performing, so they can adjust, coach, reward, and manage members into achieving their highest potential at work.
- Automate repetitive tasks: Get an overarching view via a CRM dashboard of automated, repetitive tasks like order processing, order tracking, and inventory control. When the CRM takes care of tasks like forwarding customer messages to the right rep and sending automatic email messages to customers at the right time, teams can focus on the high-touch/high-yield aspects of the sales journey.
Monitoring a CRM Dashboard With Software
CRM software is full of data; a CRM dashboard is a way for sales, marketing, and customer service leaders—as well as senior executives and/or business owners—to turn that data into an accessible resource that will aid them in making quick, yet mindful decisions. NetSuite’s CRM software is a cloud solution that delivers a real-time, 360-degree view of a business’s customers. NetSuite Customer Relationship Management provides a seamless flow of information across the entire customer lifecycle—from lead all the way through opportunity, sales order, fulfillment, renewal, upsell, cross-sell, and support.
Now more than ever, there is never a reason for sales, marketing, and customer service teams to navigate without a compass. A CRM dashboard is a visually oriented, at-a-glance resource that provides real-time, goal-oriented data to help shape and perfect sales, marketing, or customer service efforts. Businesses can expect improvements to strategy, their ability to manage people, and their bottom line when they implement CRM dashboards.
CRM Dashboard FAQs
What does a CRM do?
A customer relationship management (CRM) system is software that stores and can display real-time information related to sales, marketing, and customer service in a customizable dashboard. CRM systems allow businesses to track and view a self-selected data set pertaining to sales processes to monitor, optimize, and grow the business.
What is a CRM report?
A CRM report is a feature of CRM software that provides summaries of performance metrics as visualized data. Insights gained from this data can be used to make smarter, data-backed business decisions and improvements.
What does CRM system stand for?
CRM stands for customer relationship management.
What are examples of CRM?
Examples of how businesspeople use customer relationship management systems include:
- Sales representatives can quickly see how they’re performing and where they need to focus their efforts to meet their sales goals. Team members can decide which prospects to follow up with or which product line they need to focus on.
- A sales manager can track the progress of the entire team. They can also identify who the top performers are and who may need more attention or training.
- Marketing departments can see which campaigns and tactics create the most qualified leads and generate the most sales.
What is the purpose of a CRM dashboard?
A CRM dashboard provides companies with a digestible visualization of their real-time performance and progress toward companywide or departmental objectives. Through intuitive charts and customizable reports, these dashboards help teams make data-driven marketing and sales decisions, deliver personalized customer care, and enhance overall performance.