According to the law of supply, businesses are motivated to supply more of a product when the price the product sells for rises. However, not every good or service follows the law the same way. To demonstrate how price affects supply for a specific product, economists often create a supply curve graph. The supply curve also reflects how external factors, such as higher or lower production costs, can change — or shift — supply. Understanding supply curves can help businesses maximize their profits and ensure they have the proper amount of inventory on hand.
What Is a Supply Curve?
A supply curve is a graph that shows how a change in the price of a good or service affects the quantity a seller supplies. Price is listed on the vertical y-axis, while quantity supplied is listed on the horizontal x-axis. For most items, the curve will be a positive, upward slope, indicating a direct correlation between the two values. In other words, the higher the price of a good or service, the more of it a seller will have on hand. For example, if the price of a lawn mower increases — meaning the price a consumer pays — a hardware store will stock more, with the intention of improving its profit margin.
There are two types of supply curves: individual and market. An individual supply curve shows how one business’s quantity supplied changes as prices rise, as with the hardware store’s lawn mowers. A market supply curve shows the overall market’s supply for given prices; it’s the sum of all sellers’ supply curves, including any companies entering the market as a supplier for the first time due to the increased profitability of lawn mowers. Both new and existing suppliers’ increases in supply contribute to the positive slope of the market supply curve.
Supply data may also be presented in chart format, called a “supply schedule.” A supply chart has the same data and trends as a supply curve and comes in individual and market varieties, as well. Whether supply is shown as a chart or curve is personal preference, but curves are usually easier to quickly see relationships and interpolate data points.
Key Takeaways
- A supply curve is a graph that shows the relationship between price and supply. As prices rise, quantity supplied also typically rises.
- Depending on the elasticity of a good’s supply, supply curves vary in shape and steepness.
- External factors, such as rising production costs or new technology, can cause a supply curve to shift left or right.
- Supply curves are often paired with demand curves. Where the curves meet, an equilibrium price is set.
How Does a Supply Curve Work?
The reason why the supply curve works the way it does comes down to one word — profit. When customers are willing to pay a higher price for a product, usually due to increased demand, there’s more money to be made. Take, for example, a company that sells a computer that garners a profit of $200. If its cost to acquire the computer remains the same and demand rises for that computer — due to, say, an increase in people working remotely — the company may be able to raise the price of the computer by $100 and still continue to grow its customer base. With the profit margin of the computer increased by 50%, the company decides to increase its supply.
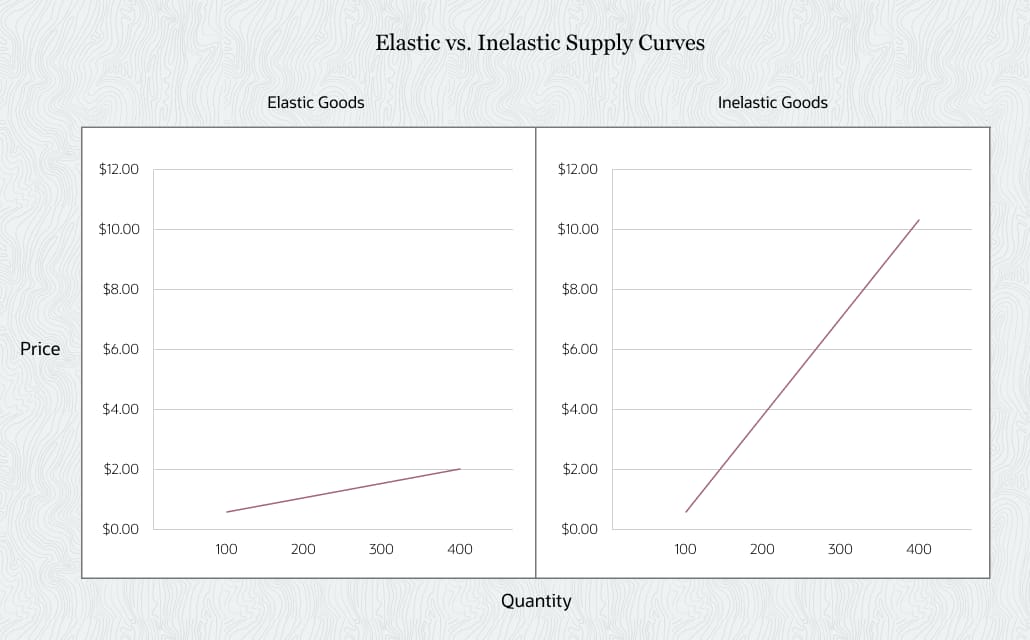
The supply curve is typically an upward slope, but the shape can vary based on elasticity, which measures the impact a change in price has on the quantity supplied. If a good’s supply cannot be easily increased when prices rise, it is considered inelastic. Agricultural products, for example, can take full seasons or even years to mature. If apple prices rise, an orchard can invest in seeds for a future crop but cannot alter its short-term production. Inelastic goods have a steeper slope on the supply curve, requiring a greater increase in price to cause a change in the amount supplied. For goods that are perfectly inelastic, meaning supply is set and can never be changed, such as a one-of-a-kind painting, the curve will be a vertical line.

As the quantity of a product sold rises, a business will eventually hit its capacity and have to decide whether to keep the amount of its supply as is or expand. Due to the potentially high costs of expansion, the supply curve will likely reflect exponential growth, showing steeper price hikes needed to increase the quantity produced. Consider a pizzeria that has only one oven; it can keep increasing pie production until that oven is full all day long. As pizza prices rise, it has two choices: either operate at its one oven’s maximum output — which puts a cap on its profit margin — or invest in another oven. (Of course, the business could raise its prices, but that may hurt demand.) That new oven could lead to higher profits, but the owner has to decide whether it can do enough business to make the investment worthwhile.
A solid understanding of the supply curve can help a business maximize its profits by showing how much of a good it can profitably supply at various prices and how to adjust inventory levels as the market fluctuates.
How Does the Supply Curve Shift?
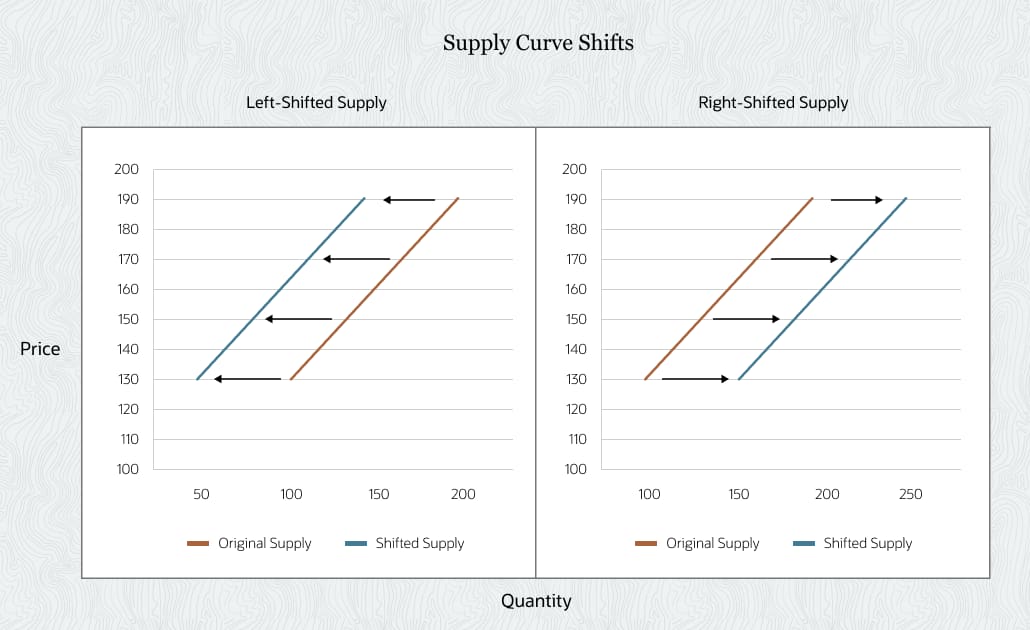
When supply is affected by something other than a change in the price customers are willing to pay, the supply curve “shifts” to the left or right.
For example, if production costs rise due to more expensive raw materials or labor, a business may not be able to produce the same quantity of a good for the same price. Let’s take a furniture company that spends $65 on raw materials and labor to make a chair that it sells for $130. The company has 100 chairs available for sale. If the price of wood rises due to a forest fire, yet demand remains the same, the store can choose to supply fewer chairs at the same price point or supply the same quantity and raise the price of the chair. Whether the business sells 100 chairs at the increased price of $160 or keeps the price at $130 but sells only 50 chairs, the supply curve would shift the same way, to the left.
A shift to the right tends to occur when a product becomes easier or cheaper to produce. Let’s say the furniture company invests in automated inventory software, which reduces its overall labor costs. Now, for the same cost, the company can make 150 chairs instead of 100. The company can lower its prices or increase supply. Either way, there is a “right-shift” for the supply curve, as the same price point will now have a higher quantity supplied, as shown above.
Some of the common reasons for a shift in supply are weather changes and natural disasters; new technology; a change in government regulations, policies or subsidies; and market changes such as new competitors or changes in production costs.

Supply Curve vs. Demand Curve
The supply curve is a valuable tool for demonstrating how sellers’ increase their supply of a product or service when prices rise. However, rising prices may also disincentivize customers and lower demand. The higher the price of a good, the higher its opportunity cost, which may increase the likelihood of buyers spending their money elsewhere. This is reflected in a demand curve, for which the curve slopes downward. Where the supply and demand curves meet is known as the “equilibrium price.” Ideally, the equilibrium price is where everyone who wants a good or service can buy it for a fair price, and the vendor is left with no surplus of the good. In the real world, however, it rarely works out perfectly, but the ability to accurately estimate the equilibrium price can help a business stick as close to “just the right amount” as it deems appropriate. Many businesses prefer to have some safety stock on hand, in case of an unexpected rise in demand or a production slowdown.
Example of a Supply Curve
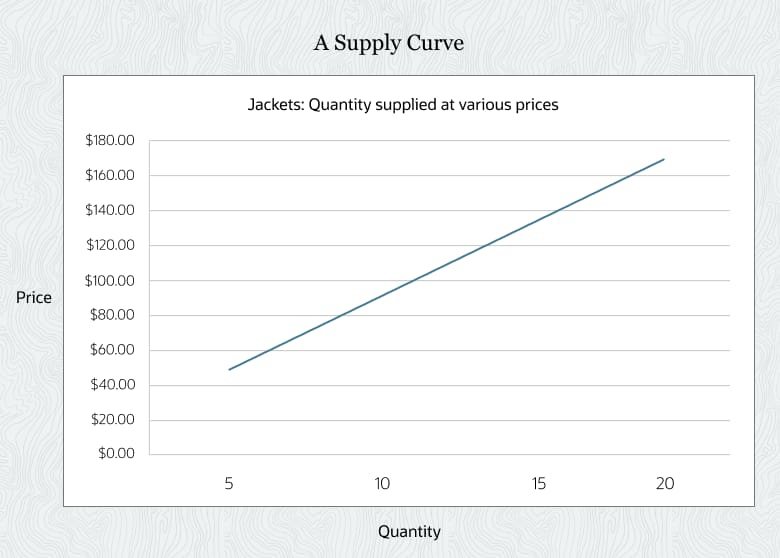
The law of supply is nearly universal and applies to almost every industry. When prices rise, sellers offer more of the product, and the supply curve is the most common way to visualize this relationship. Here is a supply curve for a department store’s supply of jackets as the price of the product increases.

If customers are willing to pay $50 for a jacket, the store may decide to allocate only one display and stock five jackets. But if the price rises to $170 due to an increase in customer demand, the business owner may decide it’s well worth setting up a few more racks and stocking 20 jackets, considering the profit margin has increased for each one.
It’s important to remember that those price changes are not due to external factors like production costs, competition or availability of raw materials. Understanding the difference between “moving along the supply curve,” meaning only a change in price is incentivizing a change in supply, and when supply is “shifting” from external market forces can help a business understand when a change in price should be met with a change in supply.
Manage Supply and Save Money With NetSuite Supply Planning
NetSuite Supply Planning helps businesses manage supply in accordance to demand, eliminating financial losses associated with overstocking or understocking an item. It eliminates manual processes associated with purchasing processes and work orders, while minimizing carrying costs and improving product availability. NetSuite Supply Planning calculates demand based on sales forecasts, historical trends and seasonal data to ensure that the right amount of goods is in stock — in the right place and at the right time — and ready to fulfill customers’ orders.
A supply curve is a simple way to visualize the law of supply: As prices rise, businesses will stock more of a good. However, a single supply curve demonstrates only the relationship between quantity supplied and prices assuming all other factors — such as production and acquisition costs and availability of resources — are equal. When other factors change, the supply curve can shift left or right, setting up a new supply schedule. When a business can identify the difference between moving along a supply curve and moving along a shift, it can adjust its supply to maximize profits and minimize waste.
Supply Curve FAQs
How does the supply curve shift?
The supply curve shifts from forces other than rising or falling prices on their own, creating a new price for a given quantity supplied. It will shift to either the right or left due to factors such as new technology that brings down costs or natural disasters that cause prices to rise.
What is the law of supply curve?
The law of supply is an economic concept that states how an increase in the price of goods or services leads to an increase in their quantity supplied. A supply curve is a graph that represents the direct relationship between quantity supplied and prices. As prices rise, so does the quantity supplied.
What causes a supply curve?
A supply curve can be caused by two factors. As prices rise, existing firms increase their supply in search of higher profits. Entrepreneurs can also enter the market upon seeing a higher profit potential to justify startup costs, creating a market supply curve.
Is the supply curve positive or negative?
The supply curve usually has a positive slope, as both prices and output rise together.
What are the 6 factors that can shift the supply curve?
Six factors that can shift the supply curve are production costs, changing costs of related products, technology, forecasted seller data, natural disasters and competition.


