
Nonprofits face a measurement paradox. Total US charitable giving hit a record $592.5 billion in 2024, yet the donor base shrank for the fourth consecutive year. In other words, the old yardsticks—such as the number of donors acquired and outputs counted—no longer tell leaders what they need to know about organizational health. What key performance indicators (KPIs) should nonprofits track instead? This article outlines 46 KPIs across six categories that offer the clearest picture of how well a nonprofit is serving its mission.
What Are Nonprofit KPIs?
Nonprofit KPIs are quantifiable metrics that track progress toward goals. They create a shared vocabulary for boards, staff, and funders to discuss whether a nonprofit is moving in the right direction.
Unlike for-profit businesses, which can default to revenue and profit margins, nonprofit missions are harder to express in a few simple numbers. Nonprofit KPIs cover everything from fundraising performance and program impact to financial health, volunteer engagement, marketing effectiveness, and operational efficiency.
Key Takeaways
- Nonprofit KPIs convert mission-driven work into measurable data that boards and funders can act on.
- Repeat donors contribute the majority of nonprofit revenue, underscoring the importance of retention.
- Financial health metrics have shifted from overhead ratios to liquidity indicators, such as months of cash on hand.
- Impact measurement is moving from counting outputs to tracking sustained outcomes—and whether those outcomes are equitable across the communities served.
- Most nonprofits lack the data infrastructure to calculate the metrics funders increasingly want.
Nonprofit KPIs Explained
A KPI differs from a general metric in that it ties directly to a strategic objective. A nonprofit might track dozens of data points, but only a handful qualify as KPIs—ones that, if they moved significantly, would change what the nonprofit does next.
The best nonprofit KPIs share several commonalities. They’re specific enough to be actionable, comparable over time, and understandable to stakeholders who don’t live and breathe data. “Donor retention rate,” for example, ticks all three boxes: It’s a precise number representing an important trend, and a board member can easily grasp why 43% is a problem when the goal is 50%. Vague measures without any clear definition—say, “community engagement”—fail those tests and end up ignored.
Why Do Nonprofits Track KPIs?
Tracking KPIs gives nonprofits the information they need to make decisions faster, defend those decisions to funders, and spot problems before they become crises. The reasons to track KPIs fall into five broad categories:
- Funding and donor retention: Donor retention rates have declined for five consecutive years, according to the Fundraising Effectiveness Project (FEP). With first-time donor retention at 24%—meaning three out of four new donors never give again—organizations that don’t track retention by cohort won’t know whether their stewardship efforts are working. Monthly giving, meanwhile, now accounts for 27% of online revenue and carries retention rates above 75%, according to M+R Benchmarks, making it a separate KPI category worth monitoring.
- Volunteer recruitment and engagement: Volunteering has rebounded from pandemic lows. A December 2025 Gallup survey found that 63% of Americans volunteered their time to a religious or other nonprofit organization in the past year, up seven percentage points from 2021. But the trend shows that volunteers favor short-term, project-based jobs over longer commitments, meaning nonprofits that only track total hours may miss the shift. Those tracking retention rates, second-engagement conversion, and volunteer satisfaction scores can modify their programs to keep up with shifting trends.
- Finance and resource management: More than one-third of nonprofits ended 2025 in operating deficit, the highest share in a decade, according to the National Foundation Fund’s “2025 State of the Nonprofit Sector Survey.” Financial KPIs, such as months of cash on hand, operating reserve ratio, and revenue diversification, have replaced overhead percentages as the primary indicators boards use to gauge organizational risk.
- Marketing and outreach: Email remains the largest digital fundraising channel. After experiencing declines in recent years, email as a revenue channel is staging a comeback. Donations attributed to email appeals increased 16% year over year, according to M+R. But only 11% of donors who started filling out a donation form actually completed it, a decline of 8% year over year. Translation: Conversion metrics continue to matter more than open rates or click-through rates.
- Impact monitoring: Funders today don’t just want to know how many people a particular program served. They want to know how it impacted the community and whether outcomes held across demographics. The shift from outputs to outcomes to equity-disaggregated outcomes requires KPIs that follow participants over time.
46 Major Nonprofit KPIs and Metrics to Track
Nonprofit metrics fall into six categories. Not every organization needs to track all 46. Which KPIs make sense depends on the mission, size, and decisions the data will support.
Donor and Fundraising Metrics
In light of a shrinking donor base, the emphasis of fundraising KPIs has shifted from acquisition volume to lifetime value and retention. With repeat donors contributing the majority of revenue, the KPIs that matter most reveal whether donors stick around—and what it costs to find new ones when they don’t.
-
Donor retention rate: The percentage of donors from the prior year who give again. The formula to calculate it is:
Donor retention rate = (Number of donors in current and prior year / Total number of donors in prior year) x 100
Nonprofits average a 42.9% donor retention rate, according to the FEP’s Q4 2024 data. But that number masks a stark gap. First-time donors retain at just 19%, while repeat donors retain at 69%. Tracking retention by segment reveals where the real problem lies and where stewardship efforts should focus.
-
Donor conversion rate: The percentage of prospects (website visitors, event attendees, email subscribers) who make a first gift. The formula to calculate it is:
Donor conversion rate = (New donors / Total prospects) x 100
Donor conversion rate tracks whether marketing efforts are hitting prospects who are likely to give and whether the donation experience eliminates noise or creates it.
-
Donor churn rate: The inverse of retention, representing the percentage of donors who gave in the prior year but didn’t give again. The formula to calculate it is:
Donor churn rate = (1 – retention rate) x 100 or Lapsed donors / Prior-year donors
If retention is 43%, churn is 57%. Framing it as churn—the same concept used in customer churn analysis—can make the urgency clearer to board members accustomed to thinking about customer loss in business terms.
-
Donor growth rate: The net change in total donors year over year, including new donors acquired and existing donors lost. The formula to calculate it is:
Donor growth rate = (Current year donors – Prior-year donors) / Prior-year donors x 100
Positive growth rates are tougher to come by these days. Nonprofits saw a 4.5% decline in donors in 2024. Consistent negative growth reflects a fundraising model that can’t replenish as fast as it loses.
-
Donor acquisition cost: The average cost of acquiring a new donor. The formula to calculate it is:
Donor acquisition cost = Total fundraising expenses / New donors acquired
Just as in customer acquisition in the for-profit world, acquiring a new donor costs more than retaining an existing one. Tracking this metric helps nonprofits evaluate whether their acquisition spending is paying off.
- Total number of donors and donations: Raw counts still matter for context, but they shouldn’t be the headline KPI. A growing donation count can hide a shrinking donor base if average gift size rises, which is exactly what’s happening throughout the sector as major donors subsidize the loss of smaller givers.
-
Average gift size: Reveals how much donors typically give per transaction. The formula to calculate it is:
Average gift size = Total dollars raised / Number of gifts
Donors who give at different levels often respond to different ask amounts and engagement strategies, which is why average gift size is a useful metric for segmenting donors and customizing appeals. Tracking average gift size uncovers patterns that aggregate numbers can miss.
-
Lifetime donor value: The total revenue a donor is expected to contribute over their entire relationship with the nonprofit. A simplified formula is:
Lifetime donor value = Average annual gift x Average donor lifespan in years
Lifetime value includes assumptions about retention rates and giving patterns, but it reframes a fundraising strategy in the context of long-term relationships rather than just annual campaigns. Nonprofits that use this metric often invest more in stewardship strategies.
Impact KPIs
Funders want evidence that programs work, and boards want to know the nonprofit is getting better at its mission. The shift from counting outputs to tracking outcomes and impact requires different data—and usually different systems. Better outcomes across demographic groups also open the door to larger, more flexible grants.
- Outcome vs. output: Outputs are activities, such as meals served or sessions delivered. Outcomes are changes in participants’ lives, such as improved food security or employment. Every program should track at least one outcome metric, not just output counts. The distinction matters because outputs can rise while outcomes stay flat, giving the illusion of progress.
-
Cost per outcome: Compares program efficiency in concrete terms. The formula to calculate it is:
Cost per outcome = Total program cost / Number of participants achieving a defined outcome
If a workforce program spends $500,000 and places 100 participants in positions lasting six months or longer, the cost per outcome is $5,000. Calculating this KPI, however, requires data integration that many nonprofits simply haven’t achieved. Still, funders request it because it uncovers efficiencies that cost per output can’t.
-
Impact rate: The percentage of participants who achieve the intended outcome. The formula to calculate it is:
Impact rate = (Number of participants achieving outcome / Total participants served) x 100
A jobs program serving 500 people that places 200 in stable employment has a 40% impact rate. That number alone doesn’t say whether the program is good or bad, however. Context matters. Tracking it over time shows whether changes to program design are boosting outcomes.
-
Program expense ratio: The percentage of total expenses that goes to programs. The formula to calculate it is:
Program expense ratio = (Program expenses / Total expenses) x 100
This is the traditional “overhead” calculation, and while it has lost favor as a standalone KPI, it still provides useful context when combined with outcome data. A high program expense ratio means little if outcomes are poor.
-
Program expense growth rate: Year-over-year change in program spending. The formula to calculate it is:
Program expense growth rate = (Current year program expenses – Prior year) / Prior year x 100
Rapid growth in program costs could reflect mission expansion. Flat spending during revenue growth, on the other hand, could reflect a failure to reinvest.
- Total number of beneficiaries served: The most commonly reported output metric. It’s necessary for context because understanding scale is important. But it’s insufficient on its own because it says nothing about whether service delivery brought about real change.
-
Program completion rate: The percentage of participants who complete a program they started. The formula to calculate it is:
Program completion rate = (Participants completing a program / Participants enrolled) x 100
Dropout rates usually signal problems with program design, accessibility, relevance, or participant support. A good rule: Anything below 50% completion is a reason for investigation.
-
Sustained outcomes over time: The percentage of participants whose outcomes persist 6 or 12 months after program exit. The formula to calculate it is:
Sustained outcomes over time = (Participants with sustained outcomes at follow-up / Participants with achieved initial outcomes) x 100
This is the hardest impact KPI to track because it requires longitudinal follow-up—contacting former participants, maintaining their records, and linking intake data to follow-up surveys. But it’s increasingly what funders mean when they ask about “real impact.”
Volunteer Engagement Metrics
The same retention crisis affecting donor programs applies to volunteers. Most nonprofits know how many people showed up, but few track how many came back—or why they didn’t. The following KPIs measure whether a volunteer program is building a reliable base or running on a treadmill of never-ending recruitment.
-
Volunteer growth rate: Net change in the number of active volunteers year over year. The formula to calculate it is:
Volunteer growth rate = (Current-year volunteers – Prior-year volunteers) / Prior-year volunteers x 100
Gallup found that volunteering for nonreligious organizations hit 55% in 2025—an eight-point jump from 2021 and the first majority-level reading for this metric. Volunteering for religious organizations was at 39%, up four points.
-
Volunteer retention rate: The percentage of volunteers who return for a second engagement or stay active year over year. The formula mirrors donor retention:
Volunteer retention rate = (Volunteers active in both periods / Volunteers active in the prior period) x 100
High turnover not only creates training costs and stifles program continuity, but it also signals that something about the volunteer experience isn’t working.
- Volunteer satisfaction scores: Survey-based measures of how volunteers feel about their experience. Net Promoter Score formats—asking how likely a volunteer is to recommend the nonprofit to a friend—are increasingly common. Satisfaction predicts retention and, in many cases, donor conversion as well because satisfied volunteers often become financial supporters.
-
Volunteer turnover rate: The inverse of volunteer retention, calculated as:
Volunteer turnover rate = (Volunteers who left / Total volunteers) x 100
Nonprofits with high turnover should take a good look at role design, recognition practices, communication frequency, and whether expectations match the actual experience.
Campaign Performance Metrics
Nonprofits typically reach donors via email, paid search, and a growing number of social platforms, but few can say which touchpoints result in gifts. The KPIs below separate channels that build awareness from those that generate revenue.
-
Website conversion rate: The percentage of website visitors who complete a desired action—typically a donation, but sometimes an email signup or event registration. The formula to calculate it is:
Website conversion rate = (Conversions / Total visitors) x 100
Benchmarks vary widely by traffic source. For example, paid search visitors convert at higher rates than social media referrals.
-
Ad click-through rate: The percentage of ad impressions that result in clicks. The formula to calculate it is:
Ad click-through rate = (Clicks / Impressions) x 100
Ad click-through rate is useful for evaluating creative and targeting, but it’s largely meaningless without downstream conversion data; a high click-through rate on ads that don’t lead to donations is just expensive traffic.
-
Social media engagement: Determines which social media content sparks interaction. The formula to calculate it is:
Social media engagement = (Total likes, comments, shares, and saves / Total impressions) x 100
Engagement rates vary by platform. TikTok, however, seems worth tracking separately. Its follower count grew by 37% in 2024, according to M+R. Keep in mind: While engagement shows audience interest, it doesn’t directly predict giving.
-
Social media conversion rate: The percentage of social media engagements that lead to actual donations. The formula to calculate it is:
Social media conversion rate = (Total social media visitors who complete a donation or other conversion action / Total social media visitors) x 100
For most nonprofits, social drives awareness more than donations, but that may be changing as platforms add native giving features and as audience behavior shifts.
-
Average gift size (campaign-specific): Average donation within a specific campaign, calculated as:
Average gift size (campaign-specific) = Campaign revenue / Campaign gifts
Comparing average gift size across campaigns can pinpoint which messages, audiences, or timing attract larger gifts.
-
Event conversion rate: The percentage of event attendees who end up donating, either at the event or within a defined follow-up window. The formula to calculate it is:
Event conversion rate = (Number of event attendees who make a gift / Number of event attendees) x 100
Events are expensive to produce. Knowing the conversion rate helps justify or rethink the investment. Track attendees-to-donors, not just event revenue versus event cost.
-
Email conversion rate: The percentage of email recipients who go on to make a donation within a certain timeframe. The formula to calculate it is:
Email conversion rate = (Number of email recipients who complete a donation / Number of recipients) x 100
This metric cuts through vanity metrics, such as list size and open rates, to answer the more important question: Did the email lead to a donation?
-
Email open rate: The percentage of delivered emails that recipients open. The formula to calculate it is:
Email open rate = (Email opens / Delivered emails) x 100
Platform changes (such as updated privacy protection) have made this KPI less reliable, but when tracked over time, it still reflects list health and subject-line effectiveness.
-
Email opt-out rate: The percentage of recipients who unsubscribe after a given message or campaign. The formula to calculate it is:
Email opt-out rate = (Number of recipients who unsubscribe / Total recipients) x 100
A spike could indicate message fatigue, an audience mismatch, or content that didn’t resonate. Tracking this by message type (e.g., fundraising appeals versus newsletters versus advocacy) can show which content drives people away.
Financial Metrics
Financial KPIs have shifted dramatically. Overhead ratios are no longer the sole measure of performance. Instead, liquidity, reserves, and revenue diversification now dominate finance committee discussions because they’re a better predictor of whether a nonprofit can withstand disruption.
- Annual revenue: Total revenue from all sources. This baseline for every other financial ratio is still the simplest measure of scale. Track it along with donor count. Rising revenue with falling donors signals an outsized dependence on a smaller group of larger supporters.
-
Working capital: Shows whether a nonprofit can meet its short-term obligations. The formula to calculate it is:
Working capital = Current assets – Current liabilities
A negative number is a red flag that payroll or vendor payments may be at risk. Understanding working capital helps finance committees gauge whether cash flow supports operations or just creates constant stress.
-
Fundraising return on investment (ROI): Measures how much revenue each dollar of fundraising expense generates. The formula to calculate it is:
Fundraising ROI = (Total fundraising revenue – Total fundraising expenses) / Total fundraising expenses x 100
An ROI of 400% means the nonprofit raised $4 for every $1 spent on fundraising. An ROI below 0% means it spent more than it raised. That’s another red flag, unless the investment is seeding future returns through donor acquisition that’ll pay off over time.
-
Liquidity: Cash and cash equivalents available to meet immediate obligations, usually expressed as days or months of operating expenses. The formula to calculate it is:
Liquidity = Unrestricted cash / Average daily or monthly operating expenses
The NFF found that 52% of nonprofits hold three months or less of liquidity—well below the recommended minimum. Organizations seeking to improve liquidity often start by building unrestricted reserves and decreasing revenue concentration.
-
Liabilities as a percentage of total assets: A measure of leverage. The formula to calculate it is:
Liabilities as a percentage of total assets = (Total liabilities / Total assets) x 100
Higher percentages show greater financial risk and less flexibility to manage unforeseen costs or revenue misses.
- Non-donation revenue: Revenue from earned income, government contracts, investment returns, and other non-philanthropic sources. Nonprofits with diversified revenue streams are more resilient when any single source takes a hit.
-
Revenue reliability: The percentage of revenue that’s recurring or contracted versus one-time or uncertain. The formula to calculate it is:
Revenue reliability = (Recurring and contracted revenue / Total revenue) x 100
Monthly giving, multiyear grants, and government contracts count as reliable. Event revenue and year-end appeals don’t. A higher percentage means more predictable cash flow and easier budgeting.
-
Current ratio: Similar to working capital but expressed as a ratio. The formula to calculate it is:
Current ratio = Current assets / Current liabilities
A ratio above 1.0 means the nonprofit can cover short-term obligations. Anything above 1.5 is considered healthy, but below 1.0 signals potential cash flow problems.
-
Cash runway: Months of operating expenses the organization could cover with current cash reserves. The formula to calculate it is:
Cash runway = Unrestricted cash / Average monthly expenses
This metric answers a simple question: If revenue stopped tomorrow, how long could you keep the lights on?
-
Percentage of expenses spent on fundraising: Helps nonprofits avoid spending that doesn’t contribute to the primary goal. The formula to calculate it is:
Percentage of expenses spent on fundraising = (Fundraising expenses / Total expenses) x 100
This KPI is a component of traditional overhead calculations. It’s still useful for internal benchmarking but no longer the board-level priority it once was.
-
Budget variance: The difference between budgeted and actual revenue or expenses. The formula to calculate it is:
Budget variance = ((Actual revenue or expenses – Budget) / Budget) x 100
Large variances—positive or negative—reflect forecasting issues or surprises worth investigating. Consistently large variances suggest the budgeting process itself needs work.
Operations Metrics
Operations KPIs help leaders figure out whether operations are running efficiently and whether staff capacity matches demand. Given 95% of nonprofit leaders report concern about staff burnout, these KPIs have taken on more strategic importance.
-
Overhead costs: Administrative and fundraising expenses as a percentage of total expenses. The formula to calculate it is:
Overhead costs = (Administrative expenses + fundraising expenses) / Total expenses x 100
Overhead costs reveal how much of each dollar goes to support functions versus programs, but without outcome data, it says nothing about effectiveness.
-
Administrative expense ratio: Administrative costs as a percentage of total expenses. The formula to calculate it is:
Administrative expense ratio = (Administrative expenses / Total expenses) x 100
The administrative expense ratio includes salaries for nonprogram staff, office costs, and general operations. It’s useful for understanding the organization’s cost structure beyond fundraising and programs.
-
Operating expense ratio: Operating expenses as a percentage of revenue. The formula to calculate it is:
Operating expense ratio = (Total operating expenses / Total revenue) x 100
This KPI is helpful for assessing whether expense growth is outpacing revenue growth—a pattern that’s sustainable during investment phases but dangerous if it becomes the norm.
-
Volunteer utilization rate: The percentage of available volunteer hours that are actually deployed on productive work. The formula to calculate it is:
Volunteer utilization rate = (Hours worked / Total hours available) x 100
Low utilization points to coordination problems, poor scheduling, or a mismatch between volunteer skills and organizational needs.
-
Resource utilization rate: A broader measure covering staff, facilities, and equipment. The formula to calculate it is:
Resource utilization rate = (Billable or program hours / Total available hours) x 100
Understanding utilization rates helps leaders root out waste and overwork. Underutilized resources are a missed opportunity. Overutilized resources—especially staff—lead to burnout and turnover.
- Staff workload distribution: How evenly work is distributed among team members, commonly measured with time tracking or project management data. Uneven workload distribution is often both a symptom and a driver of retention problems, caused by short-staffing and contributing to further turnover. When one person carries 60% of the load in a four-person team, they’re a flight risk.
How Do You Choose the Right Metrics for Your Nonprofit?
With 46 possible KPIs—and many more beyond this list—the risk is tracking everything and acting on nothing. The following principles help narrow the focus:
- Start with decisions, not data: Ask what choices you’ll face in the next year: Should you invest more in donor acquisition or stewardship? Is the jobs program effective enough to expand? Can you sustain a hiring plan with current reserves?
- Limit the board dashboard: Most boards can absorb 8 to 12 KPIs before their eyes glaze over. Additional KPIs can live in staff reports without cluttering dashboards.
- Include at least one quality or outcome metric per major program: Dashboards that report only volumes—donors, dollars, participants, or hours—don’t show the board whether the nonprofit is getting better or worse at its mission.
- Balance leading and lagging indicators: Lagging indicators (annual revenue, participants served) tell you what happened. Leading indicators (donor trust scores, donation page completion rate) hint at what’s on the horizon.
Track Major Nonprofit KPIs With NetSuite ERP
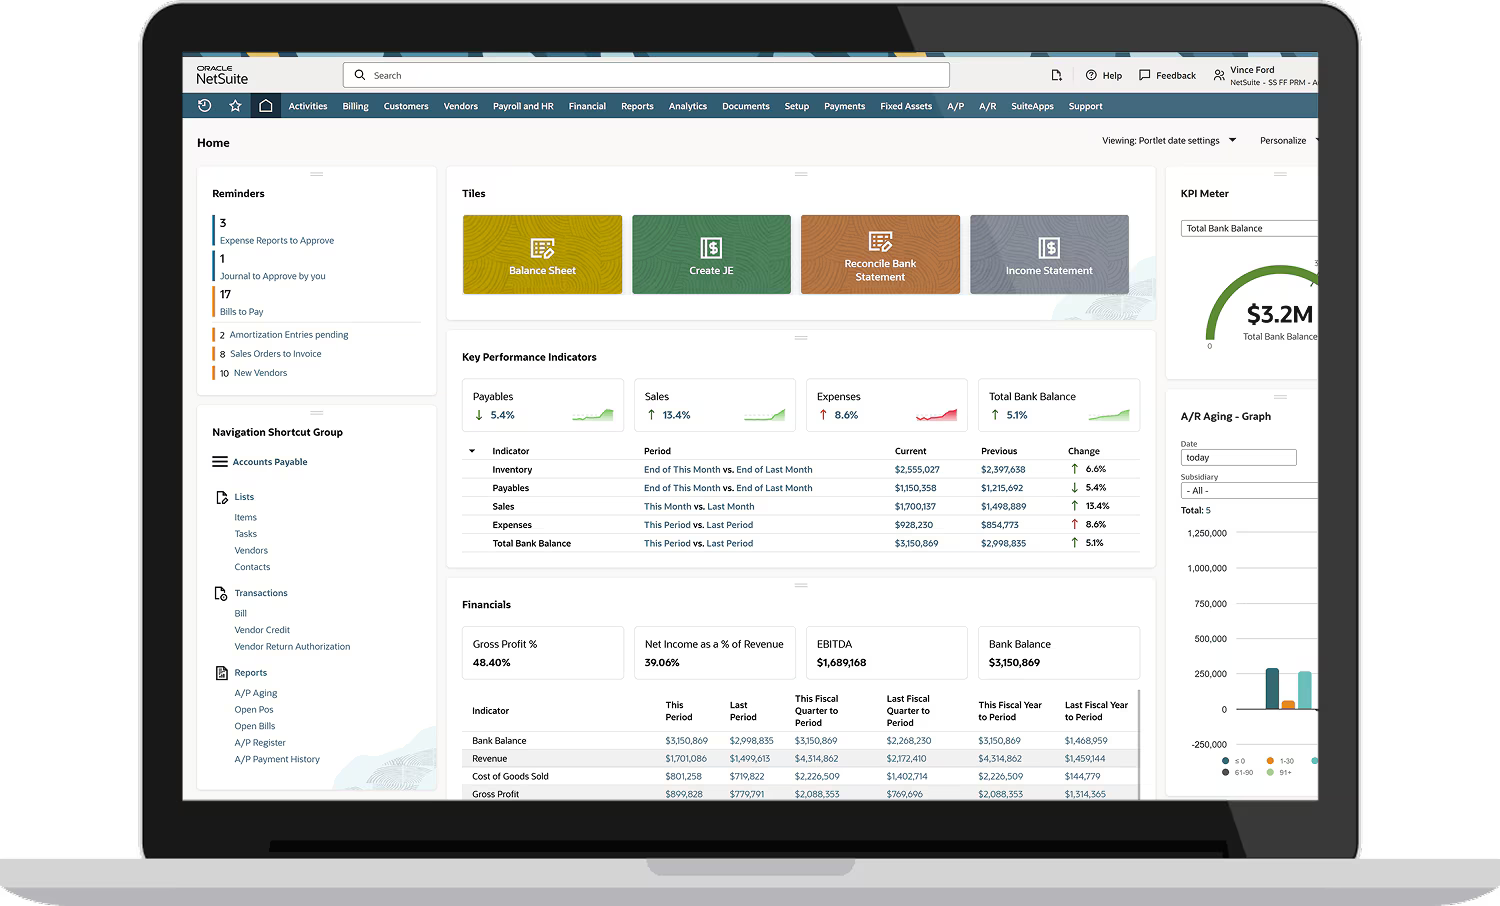
Most nonprofits run fundraising, programs, finance, and HR on separate systems, which makes pulling KPIs a process ripe for errors. NetSuite ERP for Nonprofits consolidates these functions on a single cloud platform. Fundraising data, grant accounting, and operational metrics share one database, so dashboards highlight cash runway, retention rates, and program expenses without spreadsheet exports. When the board asks a question, the answer doesn’t take two weeks. For nonprofits managing multiple programs, grants, or locations, NetSuite handles complex fund accounting while providing the consolidated view leaders seek. When funders ask for metrics that require integrated data, having that infrastructure already in place makes it possible.
Nonprofit KPIs have changed because the questions nonprofits face have changed. The 46 metrics in this article aren’t a checklist to complete. Rather, they’re a menu to choose from based on the decisions your organization needs to make. Selecting effective KPIs alone won’t guarantee success, but it’ll make it harder to be surprised by failure.
Nonprofit KPIs FAQs
How do you measure nonprofit success?
Success depends on mission, but most frameworks gauge three dimensions: impact, financial sustainability, and operational health. Key performance indicators across these areas—such as outcome rates, cash runway, and retention figures—provide the evidence.
How do you assess nonprofit performance?
Performance assessment typically combines quantitative key performance indicators (KPIs) with qualitative review. Boards examine trend lines in key metrics, compare results to benchmarks or peer organizations, and discuss context that numbers alone can’t capture. The most useful assessments focus on a small number of KPIs tied to strategic priorities.
How are nonprofit KPIs different from for-profit KPIs?
For-profit businesses can default to revenue and profit as bottom-line measures. Nonprofits pursue missions that resist easy quantification, such as reducing homelessness or improving education. This means nonprofit key performance indicators must track both mission effectiveness (impact, outcomes, participant satisfaction) and organizational sustainability (revenue, reserves, retention). The tension between the two is constant.