
We discuss everything software-as-a-service (SaaS) businesses need to understand about key performance indicators (KPIs), including which KPIs are essential, formulas, examples, calculations, and benchmarks. In addition, we provide a downloadable cheat sheet.
Inside This Article:
- SaaS KPI examples
- The functional areas to calculate KPIs
- How to choose KPIs for your SaaS company
- Downloadable SaaS KPI cheat sheet
What Are SaaS KPIs?
Software-as-a-service (SaaS) KPIs refer to performance measurements that inform a company’s financial and operational decisions. They track progress toward goals like growing market share or improving customer retention, spotlighting areas that need improvement.
SaaS companies, whether B2B or B2C, benefit most from KPIs that reflect a subscription-based business model. Recurring revenue hinges on long-term customer engagement, and the right mix of KPIs directly connects high-level outcomes, such as monthly recurring revenue and active users, with the operational metrics that drive them. Tracking both levels in conjunction gives staff a 360-degree perspective on how their activities affect the company as a whole.
Key Takeaways
- Develop KPIs to track your business development progress.
- Build the right KPIs for your SaaS business by tracking key areas like revenue and growth, marketing, sales, and customer success.
- Apply KPI benchmarking to see where you stand in your industry.
- Use a dashboard to set up automatic KPI generation so you can see your progress in one place.
SaaS KPIs vs. SaaS Metrics
Both SaaS KPIs and SaaS metrics are essential. KPIs convert metrics into goals, making them actionable targets. For example, the number of positive customer ratings is a useful metric, but the Net Promoter Score KPI can help you benchmark your business. You should always track metrics that show data about your key business areas and consider turning these metrics into KPIs.
An example is a new marketing campaign. Let’s say you develop a campaign of ads and optimized landing pages. You can track the metric of marketing qualified leads (MQLs). This metric tells you how many leads came in from those links. Measure this effort overall by calculating the KPI conversion rate—how many of those leads converted to customers. Further, you can compare your results to others across your industry with benchmarking to see if you are competitive.
Why SaaS KPIs Are So Important
SaaS businesses cannot rely on the same strategies as traditional product companies. When you depend on recurring revenue, you must have the right finance metrics in place so you can react quickly to any declines.
SaaS businesses are fast-paced. Because the business model makes enrollment easy, it is also easy for customers to churn. A SaaS business can scale fast, but that puts pressure on sales and marketing teams to sign on new customers. KPIs can be early signals of the positive and negative effects of actions your staff takes. Well-chosen KPIs can guide the company to focus on what is working and eliminate what is not.
4 Areas Your SaaS KPIs Should Cover
Your SaaS KPIs should cover four main areas: revenue and growth, marketing, sales, and customer success. Even if you decide to track only a few KPIs, make sure to cover these areas as measures of your overall business success:
- Revenue and growth: Companies, especially startups, may struggle to achieve a regular revenue stream and continued revenue growth. These KPIs provide an essential gauge.
- Marketing: These KPIs show how well a company generates interest in its products, so potential customers know about them and see their value.
- Sales: These KPIs describe the success of moving potential customers through the sales pipeline.
- Customer success: Customer-success KPIs for SaaS detail how satisfied customers are with the product, showing that the product works for them and that your staff effectively solves challenges the users may have.
SaaS KPI Matrix by Function
In developing SaaS KPIs, consider functional areas. For example, marketing may generate many leads from a digital campaign. They calculate their MQLs. When sales gets these leads, there may be only a few they can call. These sales-qualified leads (SQLs) show prospects ready to make a decision. Now those leads become converted customers.
The customer success team is then responsible for helping them figure out and best use the product. Without this attention, customers might drop their subscriptions, and that will increase the churn rate. Acquiring new and keeping current customers ties into MRR and growth.
Here is a sample matrix to decide which KPIs to use:
KPI Matrix by Function
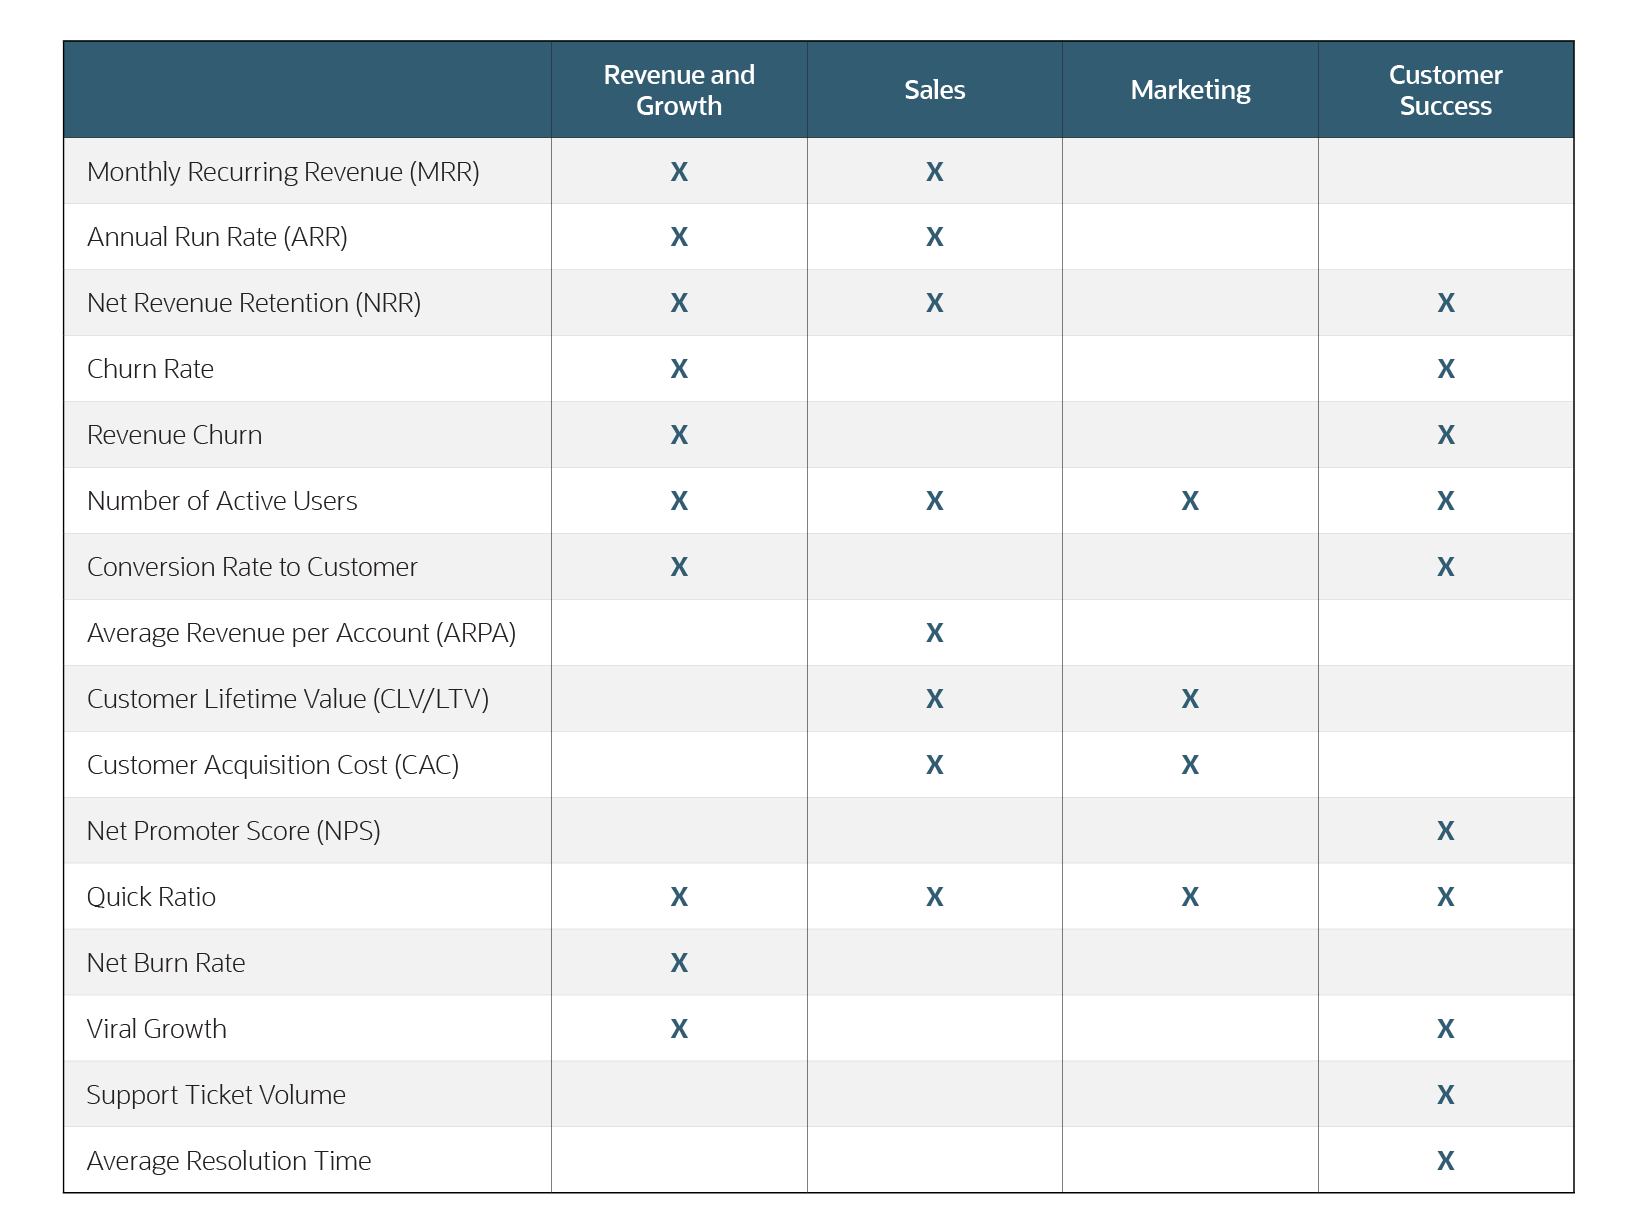
Most Important SaaS KPIs
The most important SaaS KPIs are churn, recurring revenue, customer lifetime value (CLV), and customer acquisition cost (CAC). These deliver essential insights into your customers, as well as your company’s financial health and prospects.
Beyond those four KPIs, many firms track other financial KPIs, such as average revenue per account, net burn rate, revenue churn, and quick ratio, alongside customer-focused metrics like active users, conversion rates, net promoter scores, viral growth, and support measurements. The results can help you manage and grow your SaaS business. The list below shows the most common KPIs for SaaS businesses, their formulas, and how to calculate them.
Monthly Recurring Revenue (MRR)
Monthly recurring revenue tracks monthly money coming in from new sales, upgrades, and renewals. MRR subtracts churn if you already have a calculated figure.
MRR = (Total accounts for the month) × (Rate in $ per account)
MRR is an excellent way to understand the present performance of your company and set monthly growth goals. In a simple example, if you have 500 customers paying you $15 per month, your MRR = $7,500. Do not include revenue that is one-time-only.
More complex examples come if you have tiered service levels. For instance, if you have monthly subscription costs of $20 (200 users), $50 (300 users), and $75 (400 users), your MRR will = (200 x $20) + (300 x $50) + (400 + $75) = $49,000. If you have already calculated churn (say 1.5%), subtract the 1.5% from the total revenue for a more realistic figure.
MRR = $49,000 * 1.5% = $735; $49,000 − $735 = $48,265.
Annual Run Rate (ARR)
Also known as annual recurring revenue, ARR is the yearly version of MRR. This KPI helps you project your future income, assuming that your business will not change significantly in terms of gaining new customers or churn.
ARR = (Total accounts for the year) × (Rate in $ for each account)
You can also calculate ARR by multiplying your MRR by 12. This method does not consider seasonal trends or fluctuations, such as gaining one big customer in a month. Large enterprise companies often use ARR as a replacement for MRR when they have mainly annual contracts.
For example, say your company has 5,000 accounts that pay $1,200 annually. The ARR = 5,000 * $1,200 = $6,000,000. As we showed above in the MRR calculation, you can also include more complex figures if you have them. Businesses will have different goals for MRR versus ARR.
Net Revenue Retention (NRR)
NRR takes a more comprehensive look at recurring revenue than MRR and ARR by including expansions, upgrades, downgrades, and churn over a given period. NRR above 100% indicates that expansion revenue from upsells and cross-sells outweighs losses from cancellations and downgrades. This means revenue is growing without relying strictly on new customer acquisition.
NRR = [(Starting MRR + Expansion MRR + Upgrade MRR − Downgrade MRR − Churned MRR) / Starting MRR] × 100
Some companies combine expansion and upgrade MRR into one value. Furthermore, annual NRR follows a similar formula but swaps MRR values for their corresponding ARR values.
For example, say a company begins a quarter with $100,000 in MRR. Over the quarter, existing customers add $15,000 to revenue by expanding their services and $17,000 by upgrading to higher service tiers. At the same time, downgrades subtract $3,000, and churned customers lead to another $7,000 in lost revenue.
NRR = ($100,000 + $15,000 + $17,000 − $3,000 − $7,000) / $100,000 × 100 = 122%.
This means the company’s existing recurring revenue grew by 22% without adding new customers.
Churn Rate
Churn rate is a measurement of customer attrition. Measure this KPI over a given period, such as 30 or 90 days. The period depends on the other metrics you will evaluate churn rate with, such as MRR. These are the customers canceling their subscriptions.
Churn rate = (# customers canceling / Total # of customers) × 100
This KPI should include only paying customers, not those on free versions of your software. For example, if 2,300 customers out of 200,000 total canceled last month, your churn rate = 1.15%.
You can also group customers into cohorts based on when they signed up to use your software and calculate their churn separately. Grouping into cohorts allows you to compare different timings of cancellations to see if there are issues in the software over a longer term.
Revenue Churn
Revenue churn is specific to lost revenue, not customers, although your customer losses drive it. First, calculate the number of customers lost in the period and what they were paying.
Revenue churn = (Revenue lost from lost customers in period / Total revenue at beginning of period) × 100
Use gross or net revenue churn. Net income is different only because it adds back in any extra revenue from current customer upgrades. Calculate revenue churn over a specific period; for example, you could calculate either monthly or yearly revenue churn.
In a SaaS business with $400,000 in annual revenue from current customers, the business lost $20,000 in canceled subscriptions over the year. Gross revenue churn = $20,000 / $400,000 x 100 = 5%. Taking into account customer upgrades, you can also calculate net revenue. If this same business earned an extra $4,000 in upgrades, its net revenue churn = ($20,000 - $4,000) / $400,000 x 100 = 4%. Industry standards for revenue churn are the same as churn rate.
Number of Active Users
The number of active users is the total count of unique users who perform a certain task over a specific time frame. This KPI is a leading indicator of churn; if users stop using features or logging in regularly, it signals they may downgrade or cancel. Businesses often track this figure in multiple forms, such as by daily, weekly, and monthly active users, and may further segment users who complete specific actions.
Active users = # of unique users who match criteria over a specific time frame
What qualifies as active depends on the product. For instance, say an accounting software company defines an active user as someone who logs at least one transaction or generates one report. If 3,200 unique users meet that threshold over a seven-day period, the weekly active user count is 3,200. Companies track this figure over time to assess whether product engagement is growing, stable, or declining.
Conversion Rate to Customer
Conversion rate to customer, also known simply as conversion rate, is the percentage of customers who advance from the free—sometimes called “freemium”—version of your software to the paid version.
Conversion rate to customer = (# freemium customers who go to paid software / # freemium customers) × 100
The conversion rate could also be the number of website visitors who eventually sign up to purchase your product or the number of sales leads that become customers. Regardless of the process you consider relevant for your conversion rate, the calculation is the same.
As an example, one business could have 1,000 users on its free software version. Last month, 70 of these customers upgraded to the paid version. Its conversion rate for the month = (70/1,000 x 100) = 7%.
Many businesses consider 2% to 4% a good average conversion rate, especially for sales leads to new customers.
Average Revenue per Account (ARPA)
ARPA is the payment amount per account for a period. ARPA helps companies see the average price points for new customers over time and can help improve sales and pricing.
ARPA = MRR / # of accounts
ARPA can also help companies figure out which products are the best revenue generators. Customers can have multiple accounts. Calculate this KPI at the account level and choose a consistent period, such as annual (substitute ARR for MRR) or monthly.
For instance, say a company has 2,000 accounts and generates $400,000 in revenue annually. The ARPA = $400,000/2,000 = $200 per year. There is no widely accepted industry standard for ARPA. Companies hope that it increases over time.
Customer Lifetime Value (CLV or LTV)
CLV is the revenue customers bring over their contract’s life. Churn rate is a big part of this metric, especially when you average your customers together. Therefore, the periods for churn, ARPA, and CLV should be the same in this calculation.
CLV = (1/churn rate) x ARPA
For example, a company has a churn rate of 10% and an ARPA of $25. Both are monthly rates. The CLV = 1/10% x $25 = $250 for users with monthly subscriptions. There is no industry benchmark for CLV.
Customer Acquisition Cost (CAC)
Customer acquisition cost (CAC) shows how much a business spends to get new customers. It can also show how long it takes to recoup that investment with customer revenue. This KPI is for the costs of sales and marketing.
CAC = (Total cost of sales and marketing) / (# new customers)
Companies can use CAC to show whether they can afford to put more money toward acquiring new customers. For example, a company spent $20,000 last month on salaries for salespeople and a marketing campaign. These efforts brought in 2,000 new customers. Its CAC = $20,000/200 = $100 per customer. Use this figure to determine how long it would take to pay for the initial investment to get these customers and whether it’s worth the effort.
Another good KPI is using CAC and CLV in a ratio. For example, if that same company had a CAC of $100 and a CLV of $300, the CLV:CAC ratio = $300 / $100 = 3 (or 3:1).
Net Promoter Score (NPS)
NPS is a measure of customer satisfaction and loyalty. This KPI shows your customers’ willingness to promote your products to their friends and associates.
NPS = (# promoters / Total # of survey respondents x 100) − (# detractors / Total # of survey respondents x 100)
First, companies send out simple surveys asking how likely it is people would recommend their product or brand. Then, the program groups responses as promoters (9-10) or detractors (less than 7), ignoring scores of 7 and 8.
Response rates for NPS surveys can vary widely. The more responses you receive, the more seriously you can take the survey results. Once you have all your users’ scores in, throw out the neutral (7-8) scores and calculate promoters and detractors. For example, a company had 120 email NPS surveys returned last month. Fifty of those surveys were promoters, 20 were detractors and 50 were neutral. Their NPS = (50/70) – (20/70) x 100 = 42.8.
Quick Ratio
A quick ratio is the difference between MRR added and lost. This KPI shows the direction of your growth by month. Quick ratio includes all new bookings, expansions (upgrades), contractions (downgrades), and churns for the month.
Quick ratio = (MRR added + expansion MRR) / (MRR downgrade + Churn MRR)
For example, last month, a company had $15,000 in MRR through new bookings, $2,000 in upgrades, $1,000 in downgrades, and $2,000 in churn. The company’s quick ratio = ($14,000 + $2,000) / ($1,000 + $3,000) = 4. A quick ratio score of four is a good benchmark that shows that you can replace every dollar lost with $4. Scores of 1-4 still show growth, but those companies must work very hard to keep up new bookings.
Net Burn Rate
Net burn rate is how much of its capital a company spends each month. This KPI shows the health of the company and accounts for MRR.
Net burn rate = Gross burn amount − MRR
For example, a company is spending $30,000 monthly in expenses and is bringing in $20,000 in MRR. The net burn rate = $30,000 - $20,000 = $10,000. Burn rates are seen only in companies that are still losing money. If that same company had venture capital of $180,000 left and its burn is $10,000 per month, it still has 18 months left in business, assuming it gets no new funding.
Viral Growth
Viral growth, also known as a viral coefficient, is the number of new users a current user creates. This SaaS business KPI is an incentive for customer referrals and is generated by word of mouth.
Viral growth = (# invitations sent from current users) x Conversion % / 100
Viral growth is a good indicator of company growth. For example, say your company has 100 customers. On average, they generate three referrals each. If 100 of those referrals become customers, the viral growth = 300 referrals x 33% /100 = 1. This finding means that every customer brings in one other customer. Anything above one is a good viral coefficient and helps to bring down your CAC.
Support Ticket Volume
Support ticket volume is the total number of support requests received over a given period. On its own, raw ticket count offers limited insight—more users will likely generate more tickets—so many businesses calculate this KPI as a ratio, such as tickets per active user or tickets per $1,000 of MRR. Disproportionate ticket spikes can signal product issues, unintuitive user experiences, onboarding gaps, or upcoming churn risks.
Support ticket volume = Total # of support tickets received during a specific period
Here’s how to calculate tickets per customer:
Tickets per customer = Total tickets / # of customers
Let’s say a company receives 800 support tickets in a month—that’s the support ticket volume. Dividing by total customer accounts (4,000) shows a ratio of 0.2 (800 / 4,000) tickets per customer. If the company updates its product the following month and the ratio increases to 0.35 tickets per customer—a 75% jump—it could mean the update introduced issues that require attention. Many companies segment ticket volume by priority, type, or customer tier to focus improvement efforts.
Average Resolution Time (ART)
ART measures how long it takes support staff to resolve issues. ART covers the full timeline, from ticket creation to resolution, including the wait for an initial response. Both response speed and resolution speed correlate with customer satisfaction. Monitoring ART over time, especially after new product launches, helps identify whether support processes are scaling alongside customer growth.
Average resolution time = Total time to resolve all tickets / # of resolved tickets
For example, if a support team resolves 600 tickets in a month, logging 2,400 hours of support time, ART is 4 hours per ticket (2,400 / 600). If the team improves efficiency and reduces ART to 3 hours per ticket, they could resolve 800 tickets within the same 2,400 hours (2,400 / 3 = 800)—a 33% increase in throughput. Companies can achieve these gains through additional staff, better training and documentation, improved tools, or reworked processes.
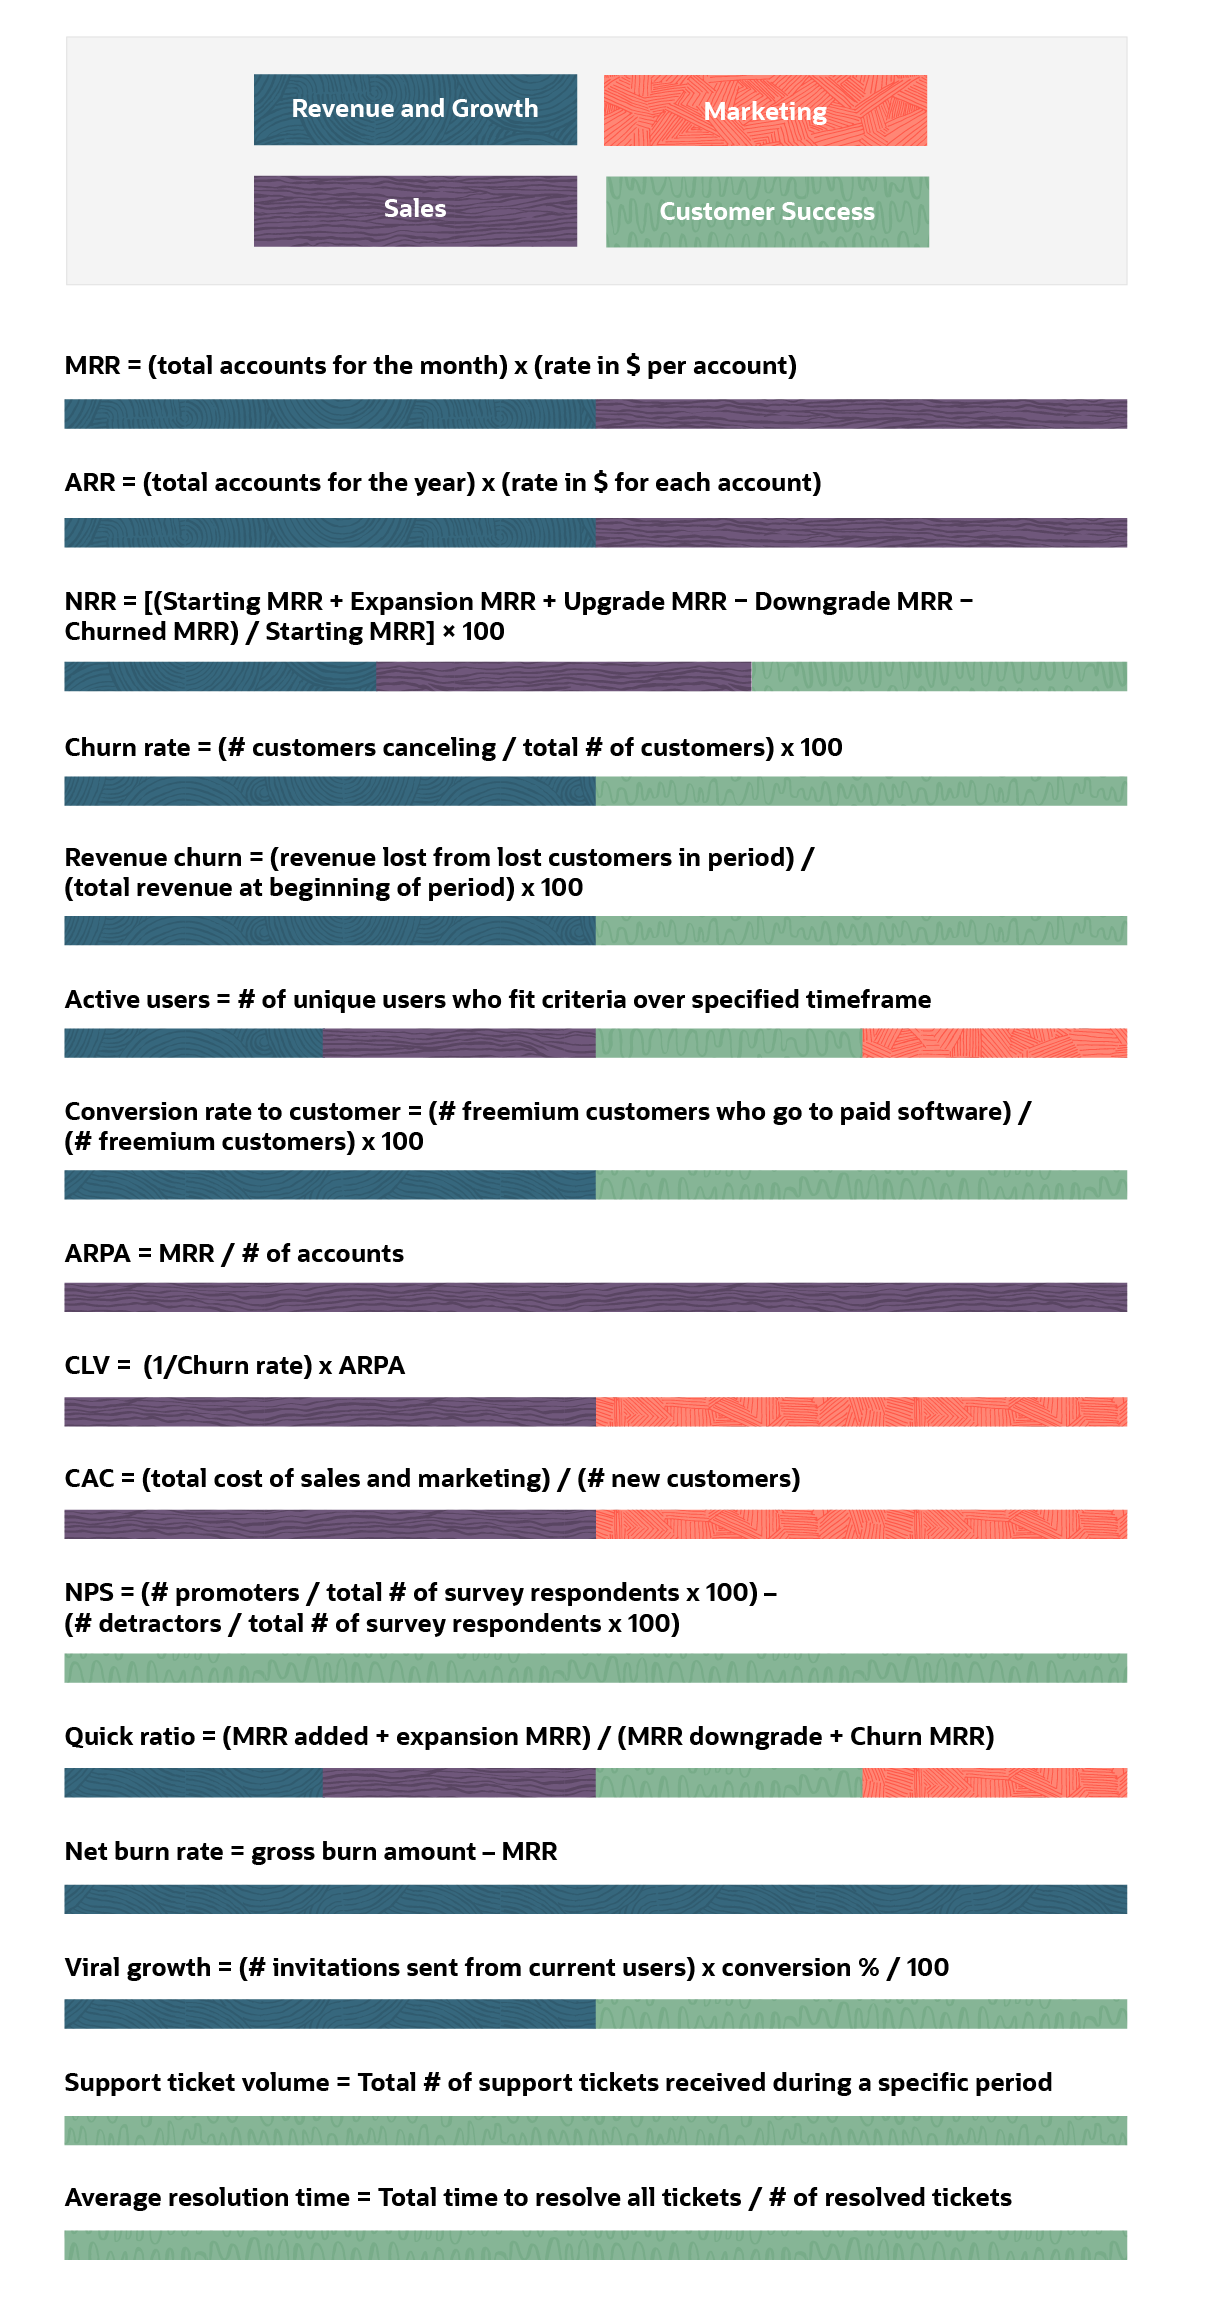
Use this downloadable SaaS KPI cheat sheet to help you with your formulas:
SaaS KPI Cheat Sheet
How to Choose the Right KPIs for Your SaaS Company
To choose the right KPIs for your SaaS company, consider the current growth phase of your business. Startups should pick KPIs that focus on funding, customer satisfaction, and proving their product has a market. A seasoned SaaS business should choose KPIs that are about growth.
In companies with a long history, KPIs should be about efficiency. For example, CAC and how much revenue each employee generates. Other tips for picking KPIs for your business include:
- Choose KPIs aligned with your business strategy: Start with the company’s strategic goals. For example, you may want your B2B SaaS business to build products that outperform competitors. Your product development KPIs are key, as is your NPS.
- Choose attainable KPIs: If needed data is too hard to acquire, it’s not worth trying to measure.
- Be specific in your KPIs: Use KPIs that are specific to the department or individual. High-level KPIs are great to show shareholders in quarterly meetings, but staff need more concrete KPIs where they can see a change. For example, your sales reps need targets. Consider measuring their sales by contact methods and their personal lead conversion rates.
- Make sure your KPIs are accurate: Choose KPIs that actually show the information you need. For example, if you want to show ARPA but ignore the differing rates customers have, you may miss the granularity of which products are the most successful.
- Review your KPIs periodically: Ask whether your KPIs still make sense and are still leading your business to success, or if they have grown stale. If your business has changed, your KPIs should also change.
Tips for Tracking SaaS KPIs
Tracking KPIs is more than setting them up and trotting them out occasionally. Start by measuring them consistently and offering employees a singular source to see their KPIs.
Additionally, you should store your KPI data in a library so you can see changes over time. Take advantage of tools available in the marketplace. For example, smart tools and technology offer tracking systems or automatically generate regular reports. Many companies find tracking their KPIs labor-intensive, but it does not have to be if you use available solutions.
Consider SaaS KPI tracking dashboards to store your data in a central location and make it easily accessible. Interactive dashboards take the manual labor out of your calculations. It may be possible to calculate your KPIs manually, but automation does the calculations much faster and more efficiently. Dashboards help your company respond to changes quickly.
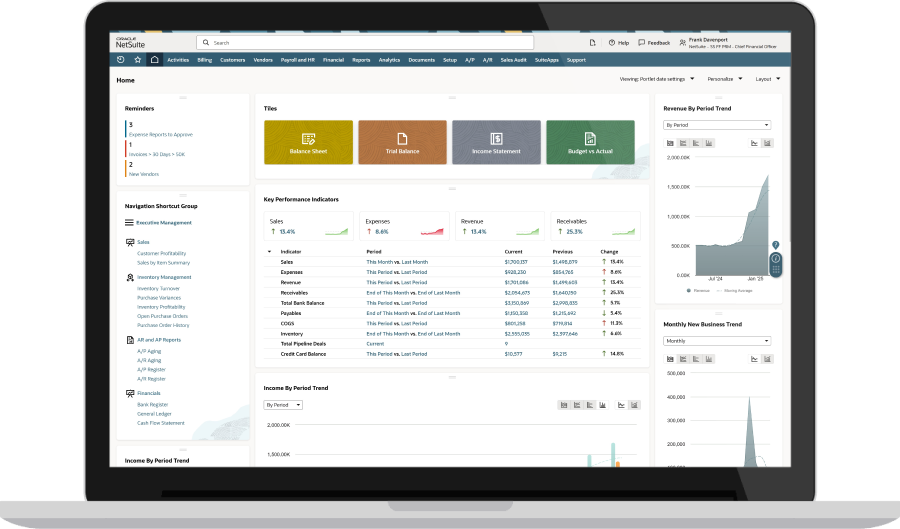
NetSuite’s SaaS Software Solutions Can Help You Realize Company Goals
Use NetSuite’s Software Edition to consolidate reporting, optimize recurring revenue, and automate billing across multiple revenue streams. NetSuite offers cloud-based ERP systems with end-to-end solutions and scalability. In addition, NetSuite has many options to meet the needs of SaaS businesses, such as historical and real-time KPI reporting, companywide visibility, and customized dashboards. Create role-specific and companywide reports, saved searches, and KPIs in your NetSuite software.
NetSuite’s ERP Dashboard
SaaS KPIs make recurring revenue models easier to understand and act on, pointing the way to improve both service quality and profitability. By tracking a mix of KPIs across revenue, growth, marketing, sales, and customer success, companies can identify what's working and repeat it, catch warning signs early, and allocate resources where they'll do the most good. But the best metrics right now may not address future challenges, so companies should regularly review and adjust chosen KPIs to sustain growth as the business matures.
SaaS KPIs FAQs
What are leading and lagging indicators in SaaS?
Leading indicators predict or signal future performance, while lagging indicators confirm past results. Some leading indicators in the software-as-a-service (SaaS) sector include activation rates and daily active users, which can signal future revenue trends. Lagging indicators, such as annual run rate, net revenue retention, gross margin, and churn rate, show how revenue and customer service strategies have performed.
What is the Rule of 40 in SaaS metrics?
The Rule of 40 states that a software-as-a-service (SaaS) company’s revenue growth rate and profit margin (typically EBITDA or operating margin) should total at least 40% when added together. Investors and management use this rule to assess whether a SaaS company is balancing growth and profitability. High-growth companies may have lower margins during scaling, while mature companies typically show stronger profitability and lower growth. For example, an ERP vendor with 25% annual growth and 20% operating margin achieves a Rule of 40 score of 45%, signifying a healthy balance.