
You may have heard it referred to as a product mix, velocity, sales mix or menu item sales report. Indeed, a PMIX report has many names that share a universal purpose: to help restaurant owners and managers manage their food costs, optimize their menus and maximize their profitability. Many successful restaurant operators turn to PMIX reports to better understand their sales data — such as the number of items sold, top-selling and underperforming items, sales patterns and server performance — but perhaps not as comprehensively as they should. Those that do, however, use PMIX data to guide many important decisions about order and inventory management, food preparation, menu selection and prices, staff allocation, promotions and more.
What Is a Product Mix (PMIX) Report?
A product mix (PMIX) report is an important restaurant tool that analyzes product sales trends and menu performance. At its most basic level, PMIX examines gross sales of menu items over a given time period, providing management with visibility into best- and worst-selling items on any given day, week or month. But the real power of PMIX comes from its more advanced, deeper analysis of sales data, such as the amount of ingredients used, plate costs, shelf life of various recipe components, location of sales and even which servers sold the most profitable items.
PMIX reports help restaurant managers make better decisions about everything from food preparation activities to menu engineering. With the right PMIX strategies, management can gain a true understanding of food costs, profitability of specific menu items and the impact of pricing adjustments on menu-item performance. Effective use of PMIX data can also help restaurants improve ordering strategies and minimize waste.
Key Takeaways
- Cost management is top of mind for restaurants today.
- Product mix (PMIX) reports shed light on what customers are ordering and the ingredients consumed during a given time period.
- Combined with plate-cost information, PMIX data allows restaurants to understand the popularity and profitability of menu items.
- Ongoing analysis of PMIX data can inform decisions about menu selection, inventory and ordering.
PMIX in Restaurants Explained
In the highly competitive food service industry, success or failure can easily come down to the smallest of percentage points. Achieving or maintaining profitability might be a matter of slightly trimming food and labor costs or promoting sales of the highest-margin menu items. Even such small changes can have a big impact on whether a restaurant will remain financially healthy and sustainable in the long run.
But how would a restaurant know its best course of action? This is where PMIX reports come into play, guiding data-driven improvements with the goal of decreasing expenses and increasing profitability. Used correctly, PMIX can also help restaurants improve cash flow, customer satisfaction and loyalty.
Simply put, PMIX data makes it possible for restaurateurs to gain an intimate understanding of what’s selling and what isn’t. Leading point-of-sale (POS) systems can break down sales details by variables like ingredients, time periods, servers, kitchen stations and restaurant locations. This information, paired with pricing and plate-cost data that details how much each ingredient costs in every meal sold, provides managers with clear visibility into both the popularity and the profitability of what they’re serving.
On a more tactical, operational basis, PMIX data can drive more economical ordering and inventory management, as well as efficient food prep that helps a restaurant keep up with demand while minimizing waste and even theft. Strategically, data about menu-item popularity and profitability can guide decisions about whether a restaurant should add, delete or modify its offerings. For example, a PMIX that identifies a highly popular menu item that is nominally profitable could lead to the decision to substitute a few expensive ingredients with less costly options. PMIX data can also help managers determine when to promote certain high-profit items that might not be performing well during certain times of the day or the week. Another way PMIX reports can help contain food costs is by pinpointing dishes that share common ingredients. This may allow a restaurant to benefit from bulk purchasing, reduce ingredient spoilage or simplify inventory and preparation processes.
The Importance of Effective Cost Management in the Restaurant Industry
According to the National Restaurant Association, a concerning 38% of restaurants reported being unprofitable in 2023; nearly all of the respondents pointed to increased labor costs (98%) and food costs (97%) as the reason. While restaurants can pass on some of these added expenses to customers through increased prices, about one in three consumers said that they’re very worried about their own personal finances and are keeping a tight rein on spending — the implication being that restaurants must be careful not to drive away customers by introducing drastic increases.
It also means that cost management is more important than ever in the restaurant industry. The more restaurants are able to minimize waste, better manage inventory and reengineer menu offerings to reduce expenses, the less exasperated their customers will likely feel when their checks arrive.
PMIX Analysis and Strategies for Reducing Food and Operational Costs
PMIX reports offer actionable insights tailored to the different needs of restaurant management and staff. For example, daily or hourly PMIX data can help line cooks more accurately predict how much food to prep at their stations. Weekly PMIX data is useful for sous chefs who set or adjust the minimum number of ingredients they will need to have on hand, aka the periodic automatic replacement (PAR) level. Monthly PMIX data looks at bigger-picture performance data pertaining to meal popularity and profitability.
1. Daily PMIX Insights
Daily PMIX data provides managers with quick insights into crucial restaurant metrics, including prep usage and menu-item performance, tailored to the day of the week.
- Variance analysis: One leading practice to prevent waste is to check for variances, or discrepancies, between the actual and forecasted amounts of prepared ingredients that were used — aka “prep usage.” This daily exercise should be performed by a kitchen supervisor, manager or someone else with close working knowledge of ingredients, recipes and station-prep schematics. This person would start by checking how much of one item was sold per the PMIX report and then compare that amount to actual prep usage in that specific station on the line. For example, if a restaurant sold 12 orders of mahi-mahi tacos the day before, there should be an equal depletion of the prep usage for mahi-mahi tacos. So, if a full pan of cabbage mix yields 24 orders of tacos and the pan was full yesterday, approximately half a pan should be left. If there is less, an investigation is in order. For example, perhaps the cooks are adding too much cabbage to the tacos?
- Predictive prep: Analyzing hourly PMIX data allows kitchen staff to optimize food-preparation schedules, especially when perishable items are involved.For example, if a restaurant is known for the warm, freshly baked rolls it serves with every signature salad, an hourly breakdown of salad orders over the past 24 hours will guide kitchen staff on how many rolls to prep and bake at certain points in the day to live up to customers’ high expectations.
- Menu-item performance: When filling out their daily prep lists, another best practice is for kitchen staff to check previous same-day sales. For example, if for the past four Sundays buffalo wing orders were down 50%, staff can decrease buffalo wing prep for the coming Sunday. Daily performance data can also help management decide when profitable items might need a promotional boost to increase order volume.
2. Weekly PMIX Insights
Weekly PMIX reports guide management with regard to ongoing tasks, like fine-tuning order quantities and assessing product shelf life.
- Ordering: Viewing menu sales tallied for a full week can inform order PARs. For example, if a restaurant sells an average of 100 orders of mahi-mahi tacos per week, serving four ounces of fish per order, it will know it needs to order about 25 pounds of fish per week. PMIX is also useful for ordering seasonal items. For example, a report that drills down on data for dessert orders during the second week of September may reveal that sales of strawberry shortcake tapered off in favor of apple pie. The manager can confidently adjust PARs for strawberries and apples with the knowledge that customers are shifting to fall flavors.
- Product shelf-life analysis: Striking the right balance between having fresh food without incurring excessive waste and associated labor is critical in restaurant operations. Weekly PMIX analyses help achieve this balance by providing data to guide the preparation of appropriate quantities to last through a product’s shelf life without excess. For example, if a restaurant’s house-made ranch dressing has a four-day shelf life, it wouldn’t make sense to prep the dressing every single day. Neither would prepping too much dressing in advance, which could lead to serving an inferior product after day four. Weekly PMIX breakdowns can provide solid estimates of how much dressing will be needed.
3. Monthly PMIX Insights
Running a monthly PMIX is a smart way to analyze the performance of individual menu items over a longer runway. This analysis is useful for strategic menu planning and cost management.
- Plate cost and PMIX analysis: Sales volume data helps restaurateurs understand how many dishes customers are ordering over time, as well as ingredient consumption. But they can’t unlock the true value of PMIX for cost reduction until they integrate that information with a detailed plate-cost analysis of every dish. Disciplined restaurants document the cost of every ingredient used in the preparation of their meals, using tracking software that monitors ingredient costs in real time. This makes it possible to analyze menu performance, food costs, revenue and profitability much more granularly.
-
Food cost percentage vs. margin analysis: Food cost percentage measures the cost of ingredients used to make a dish relative to the revenue that the dish generates.While the industry standard suggests aiming for a food cost percentage of between 28% and 32%, it’s not always necessary to reduce costs to meet this range. For instance, a high-selling steak dish with a 45% food cost might raise the overall food cost average in the PMIX report, but its substantial contribution to profit can justify the higher percentage.
The key is to evaluate the actual profit generated per dish, rather than just the cost percentage.This is where a broader margin analysis comes into play. If the PMIX report indicates a shift in sales toward more high-cost items, the restaurant’s overall food cost percentage may increase. However, its total profit might also increase if the actual dollar margin provided by the high-cost item outweighs the impact of their higher food cost percentage. Therefore, when analyzing PMIX data, it’s important to look beyond percentages and evaluate the real dollar impact on profitability.
4. Deeper PMIX Insights
In addition to pulling daily, weekly and monthly PMIX reports, restaurant operators can dig into long-term PMIX data generated quarterly or annually. Here are some key areas to explore.
- PMIX by location: For restaurants with multiple locations, comparing PMIX reports by site can reveal different menu trends. For example, a breakfast café with several locations in a busy commercial district might sell plenty of simple menu items that customers can grab on their way to work, while its residential location caters to sit-down customers who order more elaborate dishes. This information can help the business devise prep sheets and order procedures tailored to each location’s needs, rather than taking a cookie-cutter approach that could lead to overpreparation in one café and excess inventory in another.
- Kitchen-station and labor-related analysis: Analyzing PMIX data by kitchen station — grill, sauté, fry, etc. — can help identify production bottlenecks and improve crew scheduling and menu design. For example, if the grill station is responsible for 75% of orders, yet the menu is evenly distributed across all stations, this imbalance may cause longer wait times and result in disgruntled customers. Such insights can also inform staff reallocation or menu adjustments to improve service.
- Online takeout vs. in-person PMIX analysis: With integrated online-ordering systems, PMIX analysis can differentiate between takeout and dine-in preferences. Customers often choose food items differently for takeout, avoiding dishes that might not taste as good at home as they do when fresh from the kitchen. This knowledge can be used to craft a takeout-optimized menu that also prioritizes profitability and customer satisfaction.
- Server-sales analysis: PMIX reports can track how effectively each server drives sales. Management can see which staff members are consistently achieving high sales volumes and can recognize their performance. Analysis can also show the profitability of the items each server sells. It’s possible for a server to lead in sales volume yet primarily sell lower-margin items. This finding is key to guiding servers toward selling more profitable items.
Using PMIX Reports for Menu Optimization
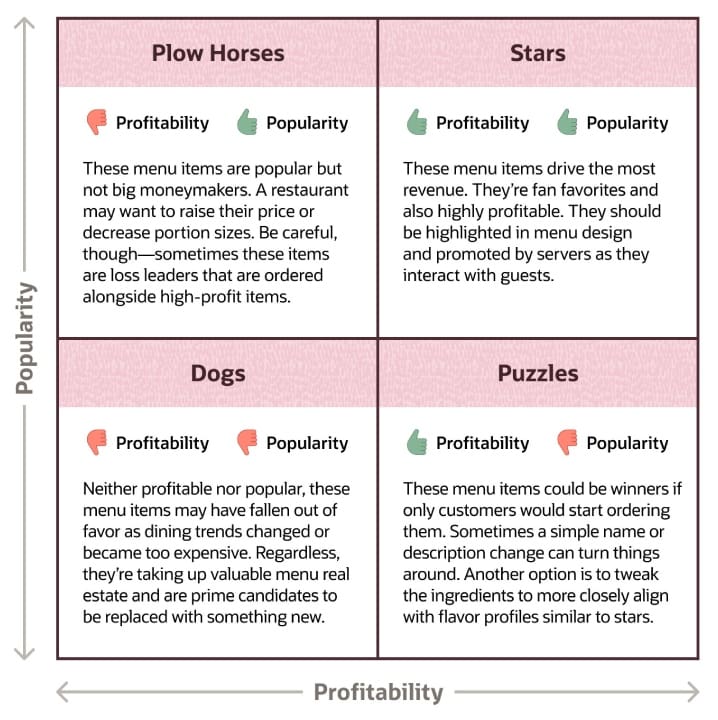
Menu engineering is a complex process that embraces both art and science. The categorization of menu items according to popularity and profitability is a well-established practice in the restaurant industry that helps owners and managers decide what to include — and not include — on their menus. Here is a breakdown of the four categories used in this process.
- Stars are highly popular, highly profitable menu items that lead PMIX reports in terms of sales volume and profitability. Stars are the restaurant’s revenue powerhouses and should be featured prominently. Some restaurateurs may test them for price rigidity to see whether guests will continue ordering the same quantity at slightly higher prices, in the hopes that they can carry even more of the load for raising average margin. Additionally, smart managers will analyze stars to understand similarities in ingredients and flavor profiles that could suggest new items that also might perform well.
- Plow horses are highly popular, low-profit menu items. In other words, customers love them, but they’re expensive to make. In a PMIX report, plow houses appear at the top of the list for sales volume but are low down for profitability. The obvious play here would be to raise prices or drive down costs for these items, either through portion control or ingredient substitution. But restaurants should tread carefully. Plow horses often draw customers over the threshold and may serve as loss leaders for the purchase of high-margin items — think, a cheap burger with an average of two high-margin beers.
- Puzzles are unpopular, high-margin items with star potential if only the restaurant could figure out how to persuade customers to order them. In a PMIX report, puzzles rest toward the bottom of the list for sales volume but rise to the top when organized by profitability. It might seem counterintuitive, but sometimes a puzzle can benefit from a slight drop in price that could potentially boost sales volume. A puzzle might also underperform because it’s not presented well on the menu. Rewording the item description or changing its placement on the menu could potentially attract more sales.
- Dogs are unpopular and unprofitable items that appear at the bottom of a PMIX report’s popularity and profitability lists. Dogs might be failed experimental items, food and beverages that customers are no longer interested in or meals that have experienced increased food costs. As restaurants seek to cut down on food costs and simplify their menus, dogs are the first place to chop.
Implementing PMIX-Driven Changes to Reduce Food Costs
Ongoing analyses of PMIX data, in concert with other key restaurant metrics, can guide purposeful changes to restaurant menus and operations. The following list highlights some PMIX-driven benefits and improvements that can help restaurants rein in their food costs.
- Identification of high-cost and low-performing items: PMIX reports allow management to easily identify high-cost, low-performing menu items, based on actual customer orders during a given time frame. This data can inform decisions about, for example, whether to raise prices or eliminate certain items from the menu. For example, a quick-service restaurant that’s not selling enough vegan bowls to justify the expense of purchasing specialty vegetables with short shelf lives may decide to eliminate them from its menu in favor of other meals that never fail to resonate with its customers.
- Menu optimization: Fine-tuning menu offerings with PMIX data goes beyond simply cutting costs; it’s about offering options that match customer preferences and maximize profitability. By analyzing sales trends, restaurants can spotlight dishes that consistently perform well and can consider introducing similar items or variations that customers might also be intrigued to order.
- Improved inventory and order management: PMIX data about sales volume can help managers more accurately predict the quantity of ingredients they’ll need to meet customer demand. This data also allows them to quickly adjust PAR levels when demand for certain dishes ebb and flow or to offer a special deal for dishes with soon-to-expire ingredients.
- Portion modifications: If a PMIX report indicates that certain dishes have increasing or disproportionate ingredient costs, one way a restaurant can address that is by slightly decreasing portion sizes. For example, reducing the chicken breast in a chicken piccata dish from 12 ounces to 10 ounces can help reduce food costs without compromising quality or being noticed.
- Prep and storage enhancements: Daily and hourly PMIX data can assist in the creation of prep schedules that align with customers’ ordering patterns, reducing waste and ensuring ingredient freshness. PMIX data can also pinpoint which ingredients are used most frequently and thus require more accessible storage. In addition, implementing a “first in, first out” system based on PMIX trends ensures that ingredients are used in the order in which they are received, minimizing the risk of spoilage.
- Informed improvements: By regularly examining their daily, weekly and monthly PMIX reports, managers can gain a true understanding of customer preferences, as well as the expenses that chip away at their bottom lines. With this information top of mind, they can reasonably experiment with menu choices, recipes, ordering practices and pricing to test their impact on sales volumes and margins.
- Cost-variance identification: PMIX data combined with plate costs can reveal where the delta lies between forecasted and actual food costs. Variances can be due to a range of reasons that need to be investigated, such as wasteful food prep practices, theft, too many customer-comped meals or poor inventory management.
- Cross-utilization of ingredients: PMIX reports can uncover menu items that use some of the same or similar ingredients. For instance, if PMIX data shows that a grilled chicken entrée and a chicken Caesar salad are both popular, the restaurant might decide to use the same type of chicken for both, buying in larger quantities for a cost advantage. Additionally, if certain dishes are leaving behind usable trimmings or by-products, these can be repurposed into other menu offerings, such as using vegetable ends for stock or meat trimmings for stews.
Maximize Your Restaurant’s Profitability With NetSuite
The use of PMIX data is just the start for restaurants that are hungry for a data-backed approach to boost profitability. Whether you’re an executive chef of a single, successful restaurant or the financial manager for a large restaurant chain, NetSuite provides a comprehensive suite of cloud-based financial management solutions that helps manage costs and revenue, streamlines planning and budgeting processes, automates complex accounting tasks and sets pricing. These tools also seamlessly integrate with additional business applications, including order management, inventory and POS systems, to provide real-time visibility and actionable intelligence across operations. With NetSuite’s scalable platform, restaurants can gain deeper insights into their financial performance, make intelligent decisions and adapt quickly to changing market conditions and consumer tastes.
Restaurants need to do everything in their power to drive down food costs and increase profit margins. PMIX data is a powerful means of helping them achieve those goals, offering robust insights into sales data and trends, menu and server performance and customer preferences. The key to success lies in the strategic use of this information to refine menu offerings, adjust inventory levels and optimize pricing. In doing so, restaurants can meet the expectations of their patrons while maintaining a healthy bottom line.
PMIX FAQs
How often should restaurants conduct PMIX analysis?
The frequency of product mix (PMIX) analysis depends on what restaurants want to know. Daily and weekly reports can help track sales volumes for more predictive prepping and ordering, while monthly or quarterly reports can help operators optimize menus and validate pricing decisions.
How can PMIX help reduce food costs in restaurants?
Paired with plate costs, product mix (PMIX) can help restaurants understand the relationship between the popularity and profitability of different menu items. This can drive more cost-effective food prepping and inventory management processes and enable operators to develop menus that save money while satisfying customers.
What is a PMIX, or product mix, in a restaurant?
PMIX refers to the mix of products sold at a restaurant within a given timeframe, including the breakdown and distribution of specific ingredients used in every dish.
How do you calculate PMIX?
Product mix (PMIX) reports are generated by point-of-sale systems that calculate the total sales during a chosen time period and determine the percentage mix of different items that make up those totals.
What is the use of PMIX?
Product mix (PMIX) reports can be used to decide how much food to order and to prep during daily or weekly intervals and also whether and how to add, modify or delete items on the menu.